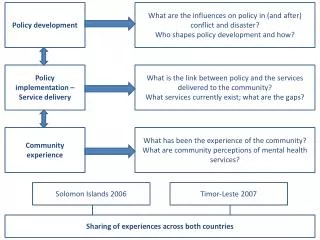
Using data in policy development
Using data in policy development. Rachel Smith-Govoni September 21, 2007. Can poor consumers pay for energy and water?. Samuel Fankhauser and Sladjana Tepic European Bank for Reconstruction and Development. Growing problem of Energy and Water poverty Manifests itself in:

Using data in policy development
E N D
Presentation Transcript
Using data in policy development Rachel Smith-Govoni September 21, 2007
Can poor consumers pay for energy and water? Samuel Fankhauser and Sladjana Tepic European Bank for Reconstruction and Development
Growing problem of Energy and Water poverty Manifests itself in: • Low consumption – cutting down on use • Not paying bills
The problem may get worse before it gets better. Why? Improvements in the services can only get better with investment and if there is a sound financial basis. This will probably involve • Higher prices • Improved ways to collect money
Measuring affordability Low income families spend a larger part of their income on utility services – electricity, heating and water Problem if safety nets not in place Affordable -the ability of certain consumers to be able to pay for something The affordability of utility services is one of many indicators to measure poverty
The affordability ratio The share of monthly household income that is spent on electricity, district heating and water Often, it is actually share of utility payments of total household consumption
Expenditure on utilities - issues Actual payments or billed amounts In transition countries the difference can be large. Expenditure assumes both fixed costs and consumption units but NOT hooking up to the service Looking at affordability of consumption rather than affordability of access Transition countries network access is generally high
1. Affordability estimates are affected by the degree of non-payment. Some households may spend little on utility services simply because they do not pay their bills. 2. Estimates reflect the often still low tariffs charged, particularly for water and district heating in the less advanced countries. Because of these inaccuracies, estimates of current affordability understate the true scale of energy and water poverty. Tariffs tend to be lowest and the payment discipline worst in low income countries. Affordability issues often least visible in the countries with the highest incidence of poverty.
Current affordability The starting point is affordability at the present time The share of expenditure currently devoted to electric power, water and district heating.
Data Data needed for affordability analysis are expenditures (or, if not available, income data) for different groups of households (for example, income deciles), as well as their energy and water payments. LSMS useful as specifically designed to measure poverty. However, household surveys differ in scope, size and quality, and this makes household data difficult to compare across countries and regions. Data from national authorities - ministries of social protection (data on vulnerable groups) and regulatory agencies (data on tariffs, consumption and collection rates).
Issues associated with energy and water expenditure data. Data are self-reported, there can be inaccuracies (measurement error) Most household surveys ask about actual payments, rather than billed amounts, and they do not report collection rates. Where debts are included in the data, it can be difficult to distinguish between actual and historic consumption. Some surveys utility expenditures are reported in aggregate and it is necessary to construct separate data for electricity, heating and water through extrapolation.
Average utility expenditures are surprisingly low In most transition countries, average electricity payments do not account for more than 5-6% of total expenditures suggesting that tariffs have not been adjusted in many of the poorer and less advanced countries. Averaged across the region (27 countries) the typical household spends: • 3-4 % of its income on electricity • 2% on district heating • 1-2% on water and waste water
Table 2: Current affordability of utility services, average household (in per cent of total household expenditure) Electricity Heating Water Albania 4.2 na 0.8 BiH 5.4 0.6 1.1 Croatia 3.9 0.4 1.3 Macedonia 5.3 0.1 1.2 SCG 5.5 4.6 0.7
Why so low? – particularly district heating 1. Tariffs are low. 2. There a substitution effect between district heating and electricity. Many households use electricity as their primary or secondary heating source either because it is cheaper or more reliable than district heating. 3. There are strong substitution effects with other sources of heat, such as natural gas, wood and coal. Which type of households is this likely to effect?
Remote ones - are generally not connected to a district heating system and households tend to heat with wood or coal. Affluent ones - usually prefer to install their own boilers rather than connect to the district heating network. The data show that for low-income urban households - which predominantly consume district heating - district heating expenditure is in fact much higher than in rural areas with district heating systems put in place.
Affordability by income group More interesting than average affordability – and of more concern – are the affordability ratios of low-income groups. Uses income deciles
Table 3: Current affordability of utility services, bottom decile (in per cent of total household expenditure) Electricity Heating Water Albania 6.0 na 1.6 BiH 8.4 0.3 0.7 Croatia 10.9 0.6 2.3 Macedonia 13.1 0.0 2.9 SCG 7.2 10.0 2.1
Affordability and non-payment One reason why affordability ratios are often acceptable under current conditions is the high level of non-payment. Non payment difficult to measure – data often not available. EBRD report 2004 estimates non payment in the 27 countries.
SERBIA LSMS 2007 С14Колики су били трошкови вашег домаћинства у претходном месецу за: 2) 1 Телефондин. 2. Мобилни телефон(збир рачуна свих чланова домаћинства)дин. 3. Комуналне услуге (вода, одношење смећа, централно грејање дин. 4. Електричну енергијудин. 5. Гас дин. С15Да ли ваше домаћинство има неплаћене рачуне за: (Упишите износ укупног дуга)Број месециИзнос 1 Телефондин. 2. Комуналне услуге (вода, одношење смећа, централно грејање) дин. 3. Електричну енергију дин .4 Одржавање зграде (заједничких просторија и лифтова ...)дин. 5. Гас дин. С16Да ли сте претходног месеца добили попуст за: Плаћање комуналних услуга 1 Да2. Не Плаћање рачуна за електричну енергију1. Да 2. Не
Future affordability From policy point of view, the affordability of future tariff increases is more relevant than the affordability of current consumption. Residential tariffs in transition countries have risen sharply over the last few years, but tariff reform remains one of the most important challenges. Regulators and policy makers need to know the social impact of reforms. Simulations of the affordability impact of future tariff adjustments can help.
Estimating future affordability requires: • Assumptions about future income growth, including those for low income households. • A better understanding of the future demand for utility services. Once these factors are known, various tariff scenarios can be superimposed on these income and consumption paths to determine what percentage of household expenditures residential users will devote to utility payments in the future.
Assumption Assumption - that total household income will rise in proportion to GDP for all income groups equally - crude, but not unreasonable On the one hand, one would expect the income of poor households to grow faster as part of a catch-up effect. On the other hand, there is evidence that over the past decade income differentials have actually increased. That is, incomes from poor households have grown at below average rates.
Affordability assuming full cost recovery by 2007 To illustrate the impact of tariff adjustments on future affordability, a hypothetical scenario is used in which • Utility prices are raised steadily to reach full cost recovery levels by 2007. • After 2007, tariffs (in local currency terms) rise in line with local currency inflation.
Affordability paths are hump-shaped The initial price rises imposed under the proposed tariff scenario are much higher than the assumed level of income growth. Therefore, the fraction of expenditures devoted to utility payments increases until tariffs reach cost recovery levels in 2007. After 2007, the analysis assumes real prices remain constant. Affordability ratios go down because of expected positive income growth.
Table 4: Affordability at cost recovery in 2007, bottom decile (in per cent of total household expenditure) 2007 2010 Electricity Heating Water Electricity Heating Water Albania 6.9 na 4.3 6.3 na 4.0 BiH 9.7 1.9 4.6 8.8 1.8 4.3 Croatia 1.2 2.1 4.5 10.4 2.0 4.3 Macedonia 17.2 0.6 11.2 15.7 0.5 10.4 SCG 15.8 34.1 8.4 14.5 32.3 7.9
Sensitivity analysis Estimates of future affordability depend on the assumptions made about future income and demand. To determine the sensitivity of estimates with respect to these parameters they recalculated the affordability ratios under two alternative scenarios. • pessimistic scenario assumes a lower level of real income growth • optimistic scenario assumes higher real income growth
Conclusion of sensitivity analysis Benchmark: expenditure on utilities should not exceed 25% of total household income Pessimistic: 14 countries of the 27 would have utility expenditure above 25% Optimistic: 2 countries have utility expenditure close to 25%
Table 6: Affordability at full cost recovery in 2010, bottom decile (in per cent of totalhousehold expenditure) 2007 2010 Electricity Heating Water Electricity Heating Water Albania 6.0 na 2.1 6.3 na 4.0 BiH 9.2 1.2 2.5 8.8 1.8 4.3 Croatia 10.9 1.4 3.7 10.4 2.0 4.3 Macedonia 16.6 0.3 6.8 15.7 0.5 10.4 SCG 12.1 14.8 6.1 14.5 32.3 7.9
Conclusion Delaying cost recovery by three years in Western Balkan countries would make little difference. Delaying tariff adjustments may not be an effective way of mitigating the social impact of tariff reform.
Vulnerable Groups Study specific groups of vulnerable consumers, rather than income deciles. Many of the households included in the bottom income deciles are pensioners, the unemployed and people living on various kinds of social benefits. Since these groups are of particular concern on social policy grounds it is useful to focus on them in more detail.
Subsistence level of energy Instead of using actual consumption they assess the cost and affordability of a set level of consumption. This level can be thought of as an entitlement – the minimum level of utility services a person should have access to. Subsistence energy consumption
Subsistence level of energy Advantages: • less data-intensive and easier to estimate • facilitate the comparison of affordability across countries • correct anomalies in consumption patterns. However, the definition of minimum consumption levels often varies depending on differences in climate, living standards and the socio-economic environment.
Subsistence levels • 600 kWh/year for electricity • 1,500 kWh/year for district heat • 22 m3/year for water. Focused on pensioners and social benefit recipients. Not unemployment benefits – which in most countries are designed to provide a partial and temporary income only Pensions and social benefits are more likely to constitute a large of income for their recipients.
Table 7: Affordability of vulnerable groups in 2003, all utility services, by minimum consumption entitlements (in per cent of total household expenditure) Pensioners Social beneficiaries Albania 3.8 10.9 BiH 6.0 6.6 Croatia 3.9 12.4 Macedonia 6.9 13.3 SCG 4.4 7.2
The estimates of Table 7 are higher than the affordability ratios of Table 4 for two reasons. 1. Vulnerable groups tend to have lower incomes even than the typical households in the lowest income decile. 2. They also rely more heavily on informal sources of income, which are not taken into account in our estimates
Vulnerable groups are particularly exposed to tariff adjustments Social support schemes will be needed to protect them from the negative impacts of tariff reform. In principle these consumers should be easier to reach through social programmes than other affected groups since they are already registered benefit recipients. In practice there is little evidence that existing support programmes have successfully targeted the most vulnerable groups.
What to do? Potential policy solutions Solution 1: Increase the tariff at the same rate as income growth In that case, affordability ratios would remain more or less stable over time.
Problems with this solution • Postpones much-needed sector rehabilitation without leading to a significant reduction in affordability ratios. • The delay in rehabilitation would also affect poor consumers, which often suffer disproportionately from the poor service quality. • Unreliable services (electric power in particular) impose a large burden on local businesses. Postponing reforms would slow down the output growth needed to lift low-income consumers out of poverty.
Solution 2: Lifeline Tariffs Lifeline tariffs - services up to a certain threshold are provided at a low or no cost. Consumption beyond this point is charged at full cost. In this way all consumers have access to a minimum level of service, but there is a price signal to large users about the true cost of the service. Block tariffs require that household consumption is metered, something that is not always cost-effective for poor consumers, especially in the water and district heating sector.
Solution 3: Targeted assistance programmes Means-tested cash payments or transfers to vulnerable consumer groups to cover minimum consumption levels. The institutional, organisational and practical constraints for implementing these solutions are considerable, and, the experience in transition countries so far has been mixed, especially in rural areas and schemes implemented at municpal level.
Solution 4: increase energy efficiency Less common are end-user efficiency programmes, which alleviate affordability problems by reducing the level of consumption needed to reach the desired service standard
Concluding comments National authorities and development organisations are gaining experience in working within existing constraints – and overcoming them. Block tariffs, for example, are now available to electricity consumers in Albania, Bulgaria and Serbia. A precondition for the establishment and wider success of all these schemes is a deeper understanding of affordability constraints and of energy and water poverty more generally.