Download
1 / 40
490 likes | 1k Vues
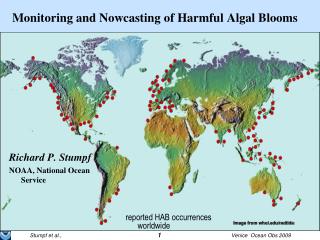
Monitoring and Nowcasting of Harmful Algal Blooms. Richard P. Stumpf NOAA, National Ocean Service. reported HAB occurrences worldwide. Image from whoi.edu/redtide. Key Contributers. Edna Granéli , University of Kalmar, Sweden, www.bom.hik.se/ngred

E N D
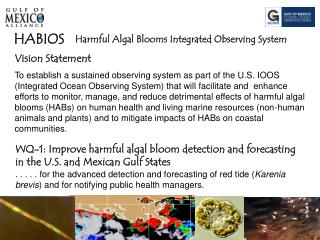
Monitoring and Nowcasting of Harmful Algal Blooms Richard P. Stumpf NOAA, National Ocean Service reported HAB occurrences worldwide Image from whoi.edu/redtide
Key Contributers Edna Granéli, University of Kalmar, Sweden, www.bom.hik.se/ngred Dennis McGillicuddy, Woods Hole Oceanographic Institution, USA, www.whoi.edu/redtide Vivi Fleming-Lehtinen, Finnish Environment Institute, Alg@line, www.fimr.fi/en Gary Kirkpatrick, Barbara Kirkpatrick, Mote Marine Laboratory, USA, www.mote.org Tim Wynne, Shelly Tomlinson, JuliDyble-Bresse, NOAA Ocean Service Karenia brevis, Florida, Photo. R. Stumpf NOAA
Distribution of some major HAB toxic events (does not include cyanobacterial blooms in coasts and lakes Amnesiac Shellfish Poisoning Paralytic Shellfish Poisoning Alexandrium spp. , Gymnodinium catenatum, Pyrodinium bahamense Pseudo-nitzschia spp. Diarrhetic Shellfish Poisoning Neurotoxic Shellfish Poisoning Dinophysis spp. Karenia spp. From www.whoi.edu/redtide
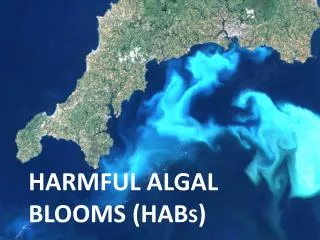
Impacts of Harmful Algal Blooms • Molluscan shellfish losses • Fish kills (threat to aquaculture) • Protected species, e.g.,manatees, whales • Tourism • Public health (respiratory, swimming) • US $1billion in loss over 10 years • $1 Billion industries at risk in east Asia & Europe
What is a “Bloom”? For “normal algae”, a bloom is an increase in concentration or higher than normal For harmful/toxic algae, a bloom is a concentration that causes harm. “A species does not have to achieve high biomass, or high population densities to be in a bloom state (Smayda, 1997) “Red tide” is inaccurate. Deadly toxicity in shellfish is possible at a few thousand cells/L (e.g. Alexandrium fundyense, Dinophysis) Microcystis, Credit: Thomas Archer, Columbus Ohio
Outline: Monitoring and Nowcasting of Harmful Algal Blooms (HABs) Problem: What is the distribution of the HAB: the “HAB Field”? • Solution, part 1: combine obs methods & technologies • Solution, part 2: combine the obs with models • Skill Assessment to identify weaknesses Ultimate objective: to solve management/public problem, not to use new technology.
Why are HABs difficult to map? they are patchy. An extremely dense patch of Karenia brevis (toxic dinoflagellate)Gulf of Mexico inlet into bay is safe good swimming here unusually intense “red tide” bad swimming here Credit: Paul Schmidt
Patchiness even with best observations Baltic, 2005, cyanobacteria, commonly estimated from satellite. This bloom missed west Öland beaches, Tourism crisis, source E. Graneli • IO Warnemunde
Satellite challenge, clouds (and ambiguous classifications) • Yellow indicates potential HAB, eastern Gulf of Mexico, 2005, worst event in 30 years • Aug 14 • Aug 12 • 2005 Aug 13 • Cloudy area interpreted using “persistence” (from a previous day) • Ambiguous algorithm, requires manual correction
Locating a HAB, sampling problem (Florida) 16 samples in a county (60 km) in a week cannot resolve finer than 26 km of coast per day Even an excellent program has limited resolution • A week of sampling in FL, source: FWRI database, research.myfwc.com Oversimplified: If you need data every day at every 1 km, then you will need to sample at least 1 day at every 1 km. Stumpf et al., JMS, 2009
Vertical patchiness: Thin Layer issue, especially Dinophysis,Resolvable with absorption measurements, provided the layer can be found. Major issue in European coastal waters Gentien et al., 2005
Outline: Monitoring and Nowcasting of Harmful Algal Blooms (HABs) Problem: What is the distribution of the HAB: the “HAB Field”? • Solution, part 1: combine obs methods & technologies
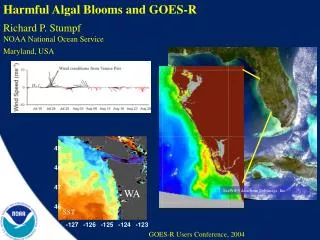
A harmful algal bloom has been identified in patches from southern Lee to central Collier County. Patchy very low impacts are possible from southern Lee County to central Collier County today through Thursday. No other impacts are expected. Solution: Find Technologies that work and integrate the observationsNOAA HAB Forecast System Gulf of Mexico • Model output • (heuristic, empirical) • Observations • (satellite imagery, • buoys, field samples, • respiratory irritation) • Synthesis • and Analysis • ConditionsReport (public) • HAB Bulletin (managers) • http://tidesandcurrents.noaa.gov/hab/
Solution: Find technologies that work and integrate them www.helcom.fi • Observations from the public • Ships of opportunity • Remote sensing • Modeling • Research vessels • Coast guards • Analyses and research
Data types: all technologies are needed • Mobile Sampling Systems (people, ships, gliders) • Pro: targeted, flexible, reconnaissance, speed and accuracy. Can be moved to where the HAB event is taking place; Quantify severity of HAB at targeted location. Provide sub-surface measurements (gliders), rapid assessment at beaches • volunteers and ships of opportunity are inexpensive. Central analysis! • Con: Limited offshore. logistical difficulty (mobilizing people, gear) , temporal frequency depends on people. • Satellite (and aircraft) Remote Sensing • Pro: Geographic coverage. Provide broad area coverage not available from other means (up to 10K sample locations per day for SW Florida) • Con: Ambiguous algorithms, need analysis with environmental data; objective rules. Need verifying in situ sampling for HAB presence and concentration; can’t yet measure currents or salinity effectively; impacted by cloudiness Aircraft methods are not standardized • Fixed Sampling Systems (piers, buoys) • Pro: Can provide continuous data in all weather conditions, day and night • Con: Detection only at a site and for “pure” HABs (<10 sample locations per day)
After 2005 crisis on Öland, Sweden, a volunteer optical technique was implemented. Eyes, filters, digital cameras, internet and shipping of critical samples Filter pad and color scale
computer translation of site Location: Sweden experimentalstudy MISS ALGA(Granéli et al) • Volunteer-based • Quick assessment of water color • Analysis of follow-up • Addresses critical sites • hik.se/hab
25 • 20 • 15 • Böda Sand • Byxelkrok • 10 • 5 • 0 • 15 • 10 • 5 • Köpingsvik • Löttorp • 0 • Kapelludden • 10 • Ispeudde • 5 • 0 • Gärdslösa • 10 • Saxnäs • 5 • 0 • Bjärby • 10 • Färjestaden • 5 • 0 • 10 • Mörbylånga • Bläsinge • 5 • 0 • Södra Bruket • 10 • Stenåsa • 5 • 0 • Total Cyanobacteria • Nodularia • 3 • 10 • 17 • 24 • 31 • 7 • 14 • July • August • 3 • 10 • 17 • 24 • 31 • 7 • 14 • July • August Location: Sweden experimentalstudy MISS ALGA(Granéli et al) • Volunteer-based • Samples every three days for more detail, and accuracy assessment
Ships of opportunity with real-time data transfer, e.g., Alg@line in Baltic. www.fimr.fi/en
35 km Monitoring with AUV (glider), patrol a transect for days or weeks, data return in hours. Kirkpatrick et al. K. brevis presence Salinity Temperature • Sep 28-30 Depth 35 m More offshore Sep 30 – Oct 02 Increased onshore Oct 02-03
Fixed sensors (example, Brevebuster in Florida) • Designed waveguide absorption meter as “Brevebuster” (Kirkpatrick et al.) • Deployed on mooring and on AUV (Slocum gliders) Karenia brevis present Karenia brevis absent Kirkpatrick et al.,
Confirmed Coastal Zone Color Scanner, Nov 14, 1978, one month after launch Field documented (by coincidence) “Red Tide”HAB of Karenia brevis (then Gymnodinium breve) Demonstrated the potential value of ocean color (Used by Steidinger and Haddad, 1981) But chlorophyll concentration is insufficient.
Med-high • low • v.low • none • x Remote sensing: Blooms as a change in concentration, combined with other rules (seasonality, location, shape, previous data) HAB located with satellite, field data, and ruled-based (heuristic) model. SeaWiFS data. (Tomlinson et al., 2008) 11 Nov 2004 • Cell counts • HAB • FWRI & Collier Co. • Non-HAB (Rhizosolenia) Key West
MERIS, additional bands provide analysis of intense blooms • No Bloom • “Negative • Cyano Index” MERIS not MODIS • Bloom negative • “Positive Cyano Index” Wynne et al., 2008
More specific algorithms are possible with new sensors: Microcystis (coastal & lakes) MERIS imagery using spectral shape algorithm (Wynne et al., 2008). Bloom concentrating rapidly Lake Erie, USA 2008 MERIS data
Some HABs evaluated with remote sensing Other major HABs not clearly monitored with remote sensing
Algalmaps • Combining infromation from: • Visual observations by trained volunteers • Coast guard observations from airplanes • Data from ships of opportunity • Remote sensing data Fleming-Lehtinen et al.
Outline: Monitoring and Nowcasting of Harmful Algal Blooms (HABs) Problem: What is the distribution of the HAB: the “HAB Field”? • Solution, part 1: combine obs methods & technologies • Solution, part 2: combine the obs with models
These are different types of models Numeric, transport or ecological / population (McGillicuddy et al., Gulf of Maine) Heuristic, rule-based, with numeric models as input, Stumpf et al., Gulf of Mexico Other, numeric with a statistical model for probability (likelihood) fields; Baltic, European HABES, Chesapeake Bay
Particles moved with modeled currents, and reformed to concentration 11Sep 2008 MERIS converted to particles 15Sep modeled with 11Sep observed Wynne et al. 15Sep modeled as concentration
Alexandrium Population Dynamics Model • Cyst Dist. (# / cm^2) • Endogenous Clock • Germ. rate (% / day) • Growth = min ( f(PAR) , g(T,S) ) • Upward swimming 10 m/day • “Mortality” = 0.1 per day • Growth (per day) McGillicuddy, Anderson et al.
Example 3-D Transport, (hydrodynamic + population) Running from initial conditions. Gulf of Maine McGillicuddy, He, Anderson et al.
Ecological Models • 3-D Hydrodynamic/Ecological • e.g. Gulf of Maine model, has ecological initation from cysts (then used as a transport model) No optics (cannot see Alexandrium) 3-D: Norway moncoze model for flagellates (Chatonella, however not useful for major Alexandrium and Dinophysis) • Heuristic (expert “fuzzy” logic) • e.g. EU HABES project (Alexandrium inputs)
Bluegreen algae situation in July 2006 Fleming-Lehtinen et al.
Outline: Monitoring and Nowcasting of Harmful Algal Blooms (HABs) Problem: What is the distribution of the HAB: the “HAB Field”? • Solution, part 1: combine obs methods & technologies • Solution, part 2: combine the obs with models • Skill Assessment to identify weaknesses
Skill Assessment: Identifies areas for investigation. What is the forecast resolution? Karenia brevis: Respiratory impact, evaluated by lifeguards listening for coughing, data transmitted by Blackberry. Kirkpatrick: coolgate.mote.org/beachconditions Stumpf et al., 2008, J.Marine Systems
Gulf of Maine: Quantitative skill evaluation: Resolution again • r2 = 1 - var(misfits)/var(observations). • Stock et al. (2005) • 1993 RMRP surveys
Why is the difference? Patchiness, and lack of resolution on the initialization, difficulty of assimilating data (in Gulf of Maine) no sample here sample here Credit: Paul Schmidt
Data Problems Aug 20 modeled from Aug 14 MERIS Nowcasts,Forecasts depend as much on the HAB field as on the model • Modeled transport should allow for ensembles of • Interpreted HAB fields • probability fields Aug 20 modeled from Aug 17 MERIS Aug 20 Observed from MERIS 20 Aug MERIS with NOAA analysis
Nowcasts and forecasts need data and model integration for HAB locations. • Problem: Determine the HAB “field” (distribution) • Better nowcasts and forecasts need better resolution observations • Solution: Combine all technologies, from ancient to modern • Solve the problem, not use the most exciting technology • Solution: Data assimilation needed, • Integration needed for HAB fields, currently all methods require expert analysis. • Ensemble initialization needed to determine uncertainty in HAB forecast • Forecast skill assessment: identify weaknesses • Ultimate objective: to solve management/public problem, not to use new technology.