DB2 performance Tips
DB2 performance Tips. 2009/10/15 Hong, Mee Hee GTS. MTS. , IBM Korea. Performance 의 의미는 ?. Performance ( noun ) “The fulfillment of a claim, promise, or request”. Online Response time 초당 수행된 Transaction Transaction 당 지불 비용 Batch Elapsed time CPU time Query 처리

DB2 performance Tips
E N D
Presentation Transcript
DB2 performance Tips 2009/10/15 Hong, Mee Hee GTS. MTS. , IBM Korea
Performance 의 의미는 ? Performance ( noun ) “The fulfillment of a claim, promise, or request” • Online • Response time • 초당 수행된 Transaction • Transaction 당 지불 비용 • Batch • Elapsed time • CPU time • Query 처리 • Response time • 분당 처리되는 Query 수치 • Throughput 을 최대로 • Concurrent user 수를 최대로 • Hardware / Software 자원 사용을 최대로 • (부족한) System resource 에 대한 application 영향을 최소로 • User 들이 아직 불만스러워 하는가? • Upgrade 비용을 지불 할 필요는 없는가 ?
Performance Management 란 ? • “The task of altering the • system environment (hardware & software), • applications (programs and database) and • staff (training or re-allocation!) • in order to meet previously defined • performance objectives.”
Performance Objective 결정 절차 • 일반적인 objective 로 정하지 않도록 • CPU time, elapsed time, memory usage 경감 • Throughput, responsiveness, concurrent user 증가 등 • 바람직한 performance objective 는 : • 구체적이고 (Specific) • 수량화 되고 (Measurable) • 달성가능하고 (Achievable) • 상대적인 (Relevant) “You can’t manage what you can’t control; you can’t control what you can’t measure”
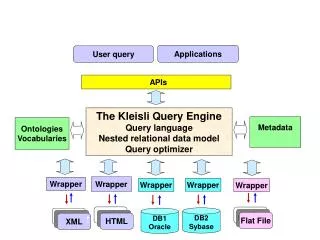
presentation network Application logic network Database processing DB2 Response Time 결정 요소 들 전반적 transaction 흐름
Application Space DB2 transaction plan program a statement 1 statement 2 . . package a statement 1 statement 2 . . program b statement 1 statement 2 . . package b statement 1 statement 2 . . Response Time Scope
DB2 System Tuning • Dataset Open/Close • Buffer Pool 과 Group Buffer Pool • Lock/Latch • Log • EDM Pool • System CPU time
Dataset Open/Close • Rule-of-Thumb: • NUMBER OF DATASET OPENS < 0.1 ~ 1 / sec • #DSETS CONVERTED R/W -> R/O < 10-15 / minute • Recommendations • System checkpoint : CHKFREQ=2-5 (minutes) • PCLOSEN/T 를 조정하여 pseudo close 빈도를 줄이도록 • CLOSE(YES) 를 design default 로 지정 (V8)
Buffer Pool Tuning • PAGE-IN FOR READ / WRITE • 전체 Buffer Pool 이 real storage 내에 Backup 되지 못하면 PAGE-IN for READ 혹은 WRITE I/O가 발생함 • Buffer Pool 크기가 Real storage영역보다 과도하게 지정된 경우 • ALTER BPSIZE command 를 이용한 BP expansion 의 경우 • Rule-of-Thumb ( steady-state ) : • PAGE-IN for READ <1-5% * (pages read) • PAGE-IN for WRITE <1-5% *(pages written)
Buffer Pool Tuning • Long Term Page Fix : I/O 가 빈번한 Buffer Pool 대상 • Buffer i/o intensity = [pages read+ pages written] / [number of buffers] • “ALTER BPOOL(name) PGFIX(YES|NO)”로 지정 상기 예의 경우 : BP32K, BP4, BP3, BP2 가 우선 고려 대상 ( BP5 는 Data in memory 의 개념 : Hit ratio = 100 %)
Group Buffer Pool Tuning • GBP Read Tuning • SyncRead (XI) nodata = 15K, SyncRead (XI) = 183K+15K • SyncRead (XI) miss ratio = 15K/(183K+15K) = 7.6% (양호함 ) • SyncReadXI miss ratio = (SyncReadXI-nodata / SyncReadXI) > 10%이면 GBP 가 부족함을 의미 하므로 추가 지정하여야 합니다. • Register Page List request = sequential, list, or dynamic prefetch request
Group Buffer Pool Tuning • GBP Write Tuning • Pages Sync Written to GBP - force write at • Commit / P-lock negotiation • Pages Async Written to GBP • Deferred write / System checkpoint • Pages Castout • GBP-dependent 경우 LBP stats 내부의 Pages Written 에 포함됨. • Unlock Castout • GBP-dependent 경우 LBP stats 내부의 #Async. Written 에 포함됨.
Lock Tuning • Lock avoidance : • Unlock req/commit.=< 5 (양호) • ISOLATION(CS) with CURRENTDATA(NO) 로 지정 • Compress / VL update 유의 • MAX PG/ROW LOCKS HELD • <100으로 유지 • Commit 을 자주 Issue 하도록 • LOCKSIZE PAGE 지정을 우선(필요시 LOCKSIZE ROW 고려) • V8, 64bit IRLM 지원 • PC=YES • ECSA 감소
IRLM Latch Contention • Rule-of-Thumb : Recommendation • #IRLM latch contention < 1-5% * Total #IRLM Request • 실예: (양호함) • #IRLM latch contention = SUSPENSIONS (IRLM LATCH) = 1.33 • #IRLM Request = LOCK+UNLOCK+CHANGE = 31.94+7.39+1.03 = 40.36 • #IRLM latch contention Rate = 1.33*100 / 40.36 = 3.3% • 양호하다는 결론 임
Data Sharing Lock Tuning • Rule-of-Thumb : Recommendation • Global Contention Rate < 3-5% * #XES IRLM Request • 실예: (양호함) • #Global Cont. = SUSPENDS - IRLM+XES+FALSE = 0.15+0.4+0.08 = 0.63 • #XES IRLM Req. = SYNCH. XES – (LOCK+CHANGE+UNLOCK) +SUSPENDS – (IRLM+XES+FALSE) = 8.62+0.33+8.20+0.15+0.4+0.08 = 17.78 • Global Contention Rate = 0.63*100 / 17.78 = 3.54%
Data Sharing Lock Tuning • Rule-of-Thumb : Recommendation • #P-lock Negotiation < 3-5% * #XES IRLM request • 실예: (양호함) • • #P-lock Negotiation = 0.01+0.06+0.01 = 0.08 • • #XES IRLM Req. = 17.78 ( 앞장의 계산 참고 ) • • #P-lock Negotiation Rate = 0.08*100 / 17.78 = 0.5%
Thread Reuse • High volume simple transaction 에 대한 Performance 개선시 • Accounting Trace 를 이용하여 Thread reuse 를 monitor 수행 • Thread reuse 의 수준 점검 (%) : (#COMMITS-DEALLOCATION)*100/#COMMITS • 상기 예의 경우 : (974827- 212799)*100/ 974827= 78% thread reuse
Internal DB2 Latch Contention/Second • Rule-of-Thumb : Recommendation • Latch contention rate < 1K-10K / second • Accounting Class 3 trace ( latch contention 과도발생시 CPU 소모 ) • LC06 = Index split latch • LC14 = Buffer pool LRU and hash chain latch • LC19 = Log latch • LC24 = Prefetch latch or EDM LRU chain latch
Log Statistics • “READ SATISFIED - FROM ..." : Log apply (UNDO 혹은 REDO) 를 위하여 Log Manager 가 Data Manager 에게 보낸 log record 수 • Read from output log buffer 가 가장 효율적 이며 • Read from archive log dataset 의 효율이 가장 나쁨
Log Statistics • Output Log Buffer size : #UNAVAIL OUTPUT LOG BUF > 0 이면 확대 지정 Output log buffer space 가 커지면 처리 효율이 좋아지나 page in activity 는 유의하여 점검 하여야 함 • #OUTPUT LOG BUFFER PAGED IN > 1-5%* LOG RECORDS CREATED이면 확대 지정 Approximate average log record size = (LOG CIs CREATED * 4KB)/(LOG RECORDS CREATED)
EDM Pool Tuning • • EDM Pool 크기 확대 지정 기준 • -% NON-STEALABLE PAGES IN USE(PTs, CTs) < 50% • -FAILS DUE TO POOL FULL = 0 • -CT/PT HIT RATIO > 90 ~ 95% • 자주 사용하는 Plan/Package 에 대하여 Bind 시 Release(Commit) 으로 지정하여 EDM 의 크기를 적절히 유지 하도록 !
EDM Pool Tuning • Global Dynamic Statement Cache hit ratio > 90-95%유지 하도록 ! = [Short Prepares] / [Short + Full Prepares]= 98.70% • Local Dynamic Statement Cache hit ratio >70%유지 하도록 ! = [Prepares Avoided]/[Prepares Avoided + Implicit Prepares]= 62.51% • Implicit Prepare 은 Short 혹은 Full Prepare로 !
System Address Space CPU Time … • Major MSTR SRB time • Physical log write, thread deallocation, update commit (Page P-lock unlock 포함) • Major DBM1 SRB time • Deferred write, prefetch read, parallel child task, Castout, async GBP write, P-lock negotiation, Notify exit, GBP checkpoint, Delete Name (pageset close 혹은 pseudo-close 가 non GBP dependent 로 변경) • Major DBM1 TCB time • Dataset open/close, DBM1 Full System contraction • Major IRLM SRB time • Local IRLM latch contention, IRLM / XES global contention, async XES request, P-lock negotiation
DB2 Application Tuning • 대부분의 DB2 performance issue 들은 System 보다는 Application 과 연관 측면이 강함 • 세가지 주요 측면 • 물리 database design ( 정규화, index 지정, partitioning 구분, RI 지정, stats, 등 ) • SQL coding (joins 대비 subselect, stage 1 대비 stage 2 predicate, 등) • Application design (singleton select 대비 cursor 사용, dynamic 대비 static SQL, host variable 사용, commit 빈도, 등)
Accounting Trace –개요 • Application performance 개선을 위한 trace type • System 내에서 개별 application 들이 사용하는 resource 들에 대한 정보 기록 • Program 의 CPU 와 elapsed time • EDM pool 사용 상황 • Lock 과 latch • Get page request 수치 • Synchronous write 수치 • SQL statements 수행 형태와 실행 수치 • COMMIT 과 ABORT 수치 • Sequential prefetch 와 여타 performance 특성 들
Out of DB2 In DB2 Class 1 Elapsed andCPU thread allocate 1st SQL 2nd SQL Activity Time thread deallocate Accounting Class 1 Data Local application 의 경우 : Application 에서 소요된 CPU time 과 DB2 에서 소요된 CPU time 모두를 포함한 시간을 제공함. Activity Time : Class 1 Elapsed Time 과 근사한 값. Local application 의 경우 : (Elapsed – CPU) time 은 Application 의 효율성 여부를 의미함. Distributed application 의 경우 : 경우에 따라 다름.
Accounting Class 2 Data Out of DB2 In DB2 Class 1 Elapsed andCPU Class 2 Elapsed andCPU thread allocate Class 2 timer = Time spent out of DB2 = Class 1 Elapsed - Class 2 Elapsed + Waiting in DB2 = Class 2 Elapsed - Class 2 CPU Class 7 : Package/DBRM 단위의 Report 을 제공하므로 Class 2 와 유사 1st SQL 2nd SQL thread deallocate
Accounting Class 3 Data Out of DB2 In DB2 Class 1 Elapsed andCPU Class 2 Elapsed andCPU Class 3 Suspensions thread allocate 1st SQL 2nd SQL Class 8 : Package/DBRM 단위의 Report 을 제공하므로 Class 3 와 유사 thread deallocate
Accounting Time 분포 Thread activity time = Class 1 elapsed Elapsed time spent out of DB2 = Class 1 elapsed - Class 2 elapsed Elapsed time spent in DB2 = Class 2 elapsed Processing time = Class 2 CPU Waiting time = Class 2 elapsed - Class 2 CPU Suspended time = Class 3 suspension time Not accounted time = Waiting time - Suspended time
Elapsed Time in Appl in DB2 in UDF Class 2 (in DB2) Class 1 1st SQL.. (Creating Thread) SQL .. Trigger1 SQL .. UDF ...UDF SQL .. Trigger2 (Terminating Thread) UDF UDF Trigger Trigger Agent Agent, nonnested Nested Activity: Triggers, SPs, UDFs
In DB2 Out of DB2 Activity time의 분포에 따라 ... ? Activity time 의 분포를 분석할 필요가 있슴 : where is the time really spent? • Application logic 비효율성 ? • 간혹 발생하는 경우 …. class 2 CPU << class 1 CPU • Network 문제 ? • Class 2 가 active 하여야 !!!
Processing time Waiting time Processing time Waiting time InDB2 time의 분포에 따라 ... ? • DB2 trace 를 기동 시켜야 함 • Access path 의 비효율성 ? • Explain 으로 점검 • 가장 큰 waiting 요인은 ? • Class 3 와 8 분석
Scans SQL Processing Open, Close Archiving Error Checking Lock Requests Extend Synchronous I/O BSDS Processing Management Logical Logging Buffer Updates Preformat *GBP reads *Global lock requests Asynchronous I/O Deadlock Detection Physical Logging Memory Management Lock Resume Checkpoints Real Time Stats Backouts *Global lock conflict *Castout Ignore it Deallocation *P-lock negotiation resolution Update Commit *Prefetch in CF *GBP writes at commit *SYSLGRNX updates *Global unlocking at commit *GBP checkpoints TCB 와 SRB Time 분석 Application DBAS SSAS IRLM
Class 3 Suspension Type 들 ( Class 8 도 ? ) V5 V6 V7&V8
Synchronous I/O Suspension 의 수치가 클 경우? • Suspension 이 자주 발생 하는 경우 ? • GetPage 과다 발생. • Explain 기능을 이용하여 access path 조정 • Buffer pool 의 contention • BP statistics 내용 점검 • Disorganized data/indexes • Catalog 점검 후 필요시 Reorg, Runstats • 단위 Suspension 시간이 크면? • 상세 분석을 위하여 RMF Report 분석 및 performance class 4 를 on ! : • DASD contention • Control Unit cache miss • CPU contention • I/O priority 적정 여부 In DB2 Time Synchronous I/O Wait
Other Agent 의 Read 시 Suspension 발생 ? In DB2 Time Application address space DB2 address space What if ... Other agent 의 Read 에 대한 Wait ? FETCH • Suspension 발생 수치가 높으면 ? • GetPage 과다 발생 ? • Explain 을 이용한 access path 의 tuning • Buffer pool 의 contention ? • BP statistics 점검 • Data/index 분포 가 비정렬인 경우 • Catalog 점검 • Suspension 의 단위시간이 크면 ? • 상세 분석을 위하여 RMF report 및 performance class 4 분석 : • DASD contention • Control unit cache miss • 부적절한 I/O priority 지정 • Parallelism 고려사항 getpage: miss prefetch begin wait first 32 pages FETCH getpage: hit FETCH getpage: hit FETCH
Other Agent 의 Write 시 Suspension 발생 ? In DB2 Time Application address space DB2 address space Other agent 의 Write 에 대한 Wait ? What if ... UPDATE Buffer update Deferred write start UPDATE Buffer update • Suspension 발생수치가 높으면 ? • Checkpoint 가 빈번히 발생하는 경우 • DB statistics 와 CHKFREQ 점검 • 빈번히 re-reference 되는 access pattern 에 대한 Deferred write threshold 가 낮은 경우 • BP statistics 점검 • Suspension 의 단위시간이 크면 ? • DASD contention • CU cache misses • 부적절한 I/O priority 지정 UPDATE page being written wait page written
Lock/Latch Suspension 의 발생수치가 높으면 ? • 단위 suspension 별 시간이 크면 • Lock suspension • Commit 을 issue 하지 않는 transaction • Concurrent DDL 수행 • RELEASE(DEALLOCATE) 지정 • Detail analysis 를 위한 performance trace class 6 와 7 분석 • Lock suspension 의 발생이 빈번하면 • Application 문제 분석 • Incompatible workload mix • Page/Row level locking • 비효율적인 preformatting • V7 개선 사항 DB2 내부 Time Lock latch suspension 에 의한 지연