The ACT Science Test
The ACT Science Test. Goal of the ACT: to figure out if students know how to think scientifically. How: multiple choice questions based upon complicated passages. Engaging higher-order thinking skills. Science Exam overview.

The ACT Science Test
E N D
Presentation Transcript
The ACT Science Test • Goal of the ACT: to figure out if students know how to think scientifically. • How: multiple choice questions based upon complicated passages. Engaging higher-order thinking skills.
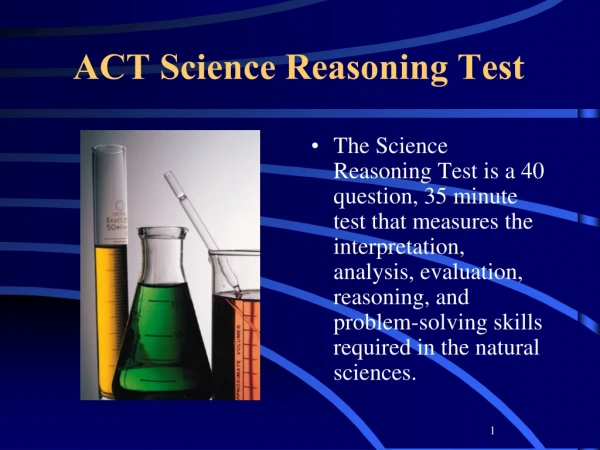
Science Exam overview • ACT Science is 40 multiple choice questions split between 7 descriptive passages and 35 minutes to answer, so go at a brisk pace! • Of those 7 passages there will be: • 3 Data Representation passages; 15 total questions(graphs, tables, or schematics will need to be interpreted) • 3 Research Summary passages; 18 total questions(a set of experiments are described) • 1 Conflicting Viewpoints passage; 7 questions(conflicting hypotheses are presented)
Science Exam overview • Helpful TipPassages with 5 questions are Data RepresentationPassages with 6 questions are Research SummaryPassages with 7 questions are Conflicting Viewpoints
ACT Science Key Mistakes • Doing complicated math-Hint there are no calculators allowed. • Not answering all the questions • Panicking/giving up-the first 2-3 per passage are the easiest. Keep working!!! I believe in you. • Reading too much/getting bogged down in details-read the questions then scan for the answers! • Trying to learn during the test- now is not the time just scan for answers.
ACT Science Test Strategies • Guess well-Educated not random • Look for stand-alone questions-these don’t require you to scan the passage. • Scan and zap-cross out answers that you have eliminated so you don’t waste time rereading them. • Be systematic • Tables and graphs are much faster than paragraphs-If asked to compare and contrast and tables or graphs are present use them! Don’t read 12 sentences if visuals will do.
Handout 1 suggested answers 1. Which of the following statements is supported by the data presented in Table 2? 2. Based on the information presented by Scientist 2, the surface of the moon is more cratered on the side that doesn't face earth because of what phenomenon? 3. According to Table 4, which conditions are more likely to show the different growth rates of oak tree species? 4. Based on the information in Tables 1 and 3, a scientist could conclude that the unknown sample contains: 5. According to the chromatography summarized in Table 4, which compound has the highest Rf?
6. Comparing Table 1 and Table 2, the batting average of the 1962 New York Mets was: 7. Based on Figure 2, the melting point of the mixture is in the range of: 8. According to Scientist 1 all primates have a common ancestor. But according to Scientist 2, there is reason to believe that some primates evolved from separate ancestors. What statement is most consistent with Scientist 2's argument? 9. Based on the passage and Table 2, who was the fastest sprinter in the 1984 Summer Olympics? ( FYI-Table 2 is the faster choice for answering this question!)
10. Suppose 10 g of acetylsalicylic acid were heated at a rate of 5 degrees/second, which graph would be most consistent with the behavior of the sample in a Differential Scanning Calorimeter? 11. According to Scientist 1, all butterflies should have six legs EXCEPT: 12. Based on Table 2, which of the following statements explains the results of Trials 2 and 4? 13. Based on the passage and Table 1, the minimum light intensity to begin photosynthesis was: [Reinforce referring to Table 1 instead of the passage.] 14. Consider Figure 2. Which of the following statements best describes the behavior of naphthalene under the test conditions? 15. According to Study 2, if the temperature of the reaction were kept constant, then the reaction would be more likely to:
16. Which of the following conclusions is NOT supported by the data presented in either the passage or Figure 1? (refer to Figure 1 instead of the passage) 17. Based on the fitted line in Figure 1, which would be a valid conclusion about the relationship of wing shape to lift in the Boeing 737 prototypes? 18. Scientists 1 and 2 have different opinions about the origin of the aurora borealis. Which statement would both scientists agree with: 19. According to Figure 2, the melting point of benzoic acid is: 20. Which of the following statements is consistent with Scientist 2's view of evolution?
Data Representation Passages • Interpreting Data Representation questions • Interpreting graphs and tables • Distinguishing between positive, negative, and no relationship graphs • Speedily retrieving answers
Interpreting Graphs In graphs there are 3 main types of relationships to remember: • Positive relationships: X goes UP so Y goes UP • Negative relationships: X goes UP so Y goes DOWN • No relationship: X goes UP and you can't tell what Y will do or it remains constant
Handout 2 Exercise 1 Answers: Graph 1: No relationship Graph 2: Positive Graph 3: Negative Graph 4: No relationship, or at least, really ambiguous relationship Graph 5: Positive Graph 6: No relationship Graph 7: No relationship
Exercise 2 Answers: 1. C 2. G 3. B 4. J 5. C 6. H 7. A 8. F 9. D 10. G The real ACT Science Data Representation questions also have text that describes their tables and graphs. Usually just a sentence or two that introduces the topic. This text may not be worth reading at all, it just depends on how the test writers were feeling that day. Scan it.
The "new iPod" Approach • You only look at the instructions if you have a problem getting the iPod to work! • The same thing is true for ACT Science questions. Look at the questions first, then look up to the tables and graphs to find the answers. Only look at the text when you need to.
Handout 3 Exercise 1 Answers: 1. D 2. G 3. A 4. G 5. C
Exercise 2 Answers: 1. B 2. H 3. C (Note: this is a time when the text actually needs to be read to see if the authors provided an explanation for the difference in N) 4. F 5. D (Note: in this case, the text provides the answer)
ACT Homework • Do the science drills! • Data Representation Passages (3)
Research Summary Passages When you get to the Research Summaries, the route to success is to: 1. Go to the questions first, not the paragraphs. 2. Hunt for the answers in tables and graphs first. 3. Only go to the text for answers if you have time.
Handout 4 • Exercise 1 Answers: • 1. C • 2. G • 3. A • 4. G • 5. C • 6. H (This is the only question that requires reading the text rather than looking at the graph). • Exercise 2 Answers: • 1. B • 2. J • 3. B • 4. F • 5. C (This question requires reading the text or prior-knowledge) • 6. F (This question requires reading the text or prior-knowledge)
Conflicting Viewpoints Passages • Introductory paragraph of controversial topic. • Next the conflicting viewpoints of the 2 scientist are given with scientific reasoning for disagreeing • Do not get interested and caught up in the reading. • Read the questions first!!!
Handout 5 Exercise 1 Answers: 1. C 2. F 3. B 4. H 5. A 6. J 7. A Exercise 2 Answers: 1. C 2. F 3. D 4. J 5. B 6. F 7. B
Science Review Over the course of this ACT Science training, we've seen many times that this section of the exam requires super-human reading comprehension and quickness. That's why we need to: • Scan and Zap (eliminate obviously wrong answers and cross them out) • Be systematic (go to the questions first, then look for the answers) • Go to tables and charts first (they are faster and tend to contain the right answers)
Handout 6 Handout 6 Exercise 1 Answers: 1. Look in Table 3. 2. Look in the text. 3. Look in a Table or Chart that lists the years 2004-2006. 4. Look in Charts 2 and 4 for info about the Boeing 737. 5. You either look in the text, or know this off the top of your head. 6. Look for a chart or table that covers trees in the year 1975. 7. Look in Figure 8 for moth leg length data. 8. Look for a table that covers homeruns in 1988. 9. This is likely to be in the text. 10. This is likely to be in a chart or graph.
Handout 6 Exercise 2 Answers: 1. Look in the text. 2. Look for a Table or Chart that covers oil production in 1921-1924. 3. Look in Chart 4. 4. Look in the Charts and Tables, but this could also be in the text. 5. Look in Graph 2 and Table 1 for global warming causes. 6. Look in the text if you don't know the answer from memory. 7. Look for a chart of people's concerns that covers 2004. 8. Look in the text. 9. Look for a chart or table that covers invasive species in North Carolina. 10. Look for a chart or table of cat species tail lengths.
Handout 6 Exercise 3 Answers: 1. Look in the Scientist 1 passage. 2. Look in the introductory paragraph. 3. Look in the first paragraphs for both Scientists 1 and 2. 4. Look in the first paragraphs for both Scientists 1 and 2. 5. Look in the Scientist 2 passage. 6. Look in the Scientist 1 passage. 7. Look in the passages for both Scientists 1 and 2. 8. Look in the introductory paragraph. 9. Look in the introductory paragraph. 10. Look in the Scientist 2 passage.