Download
1 / 22
220 likes | 370 Vues
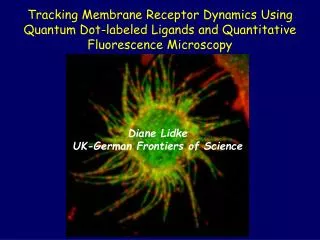
Tracking Membrane Receptor Dynamics Using Quantum Dot-labeled Ligands and Quantitative Fluorescence Microscopy. Diane Lidke UK-German Frontiers of Science. The erbB family of Receptor Tyrosine Kinases. EGF – erbB1 Neuregulin – erbB3/4 No ligand for erbB2.

E N D
Tracking Membrane Receptor Dynamics Using Quantum Dot-labeled Ligands and Quantitative Fluorescence Microscopy Diane Lidke UK-German Frontiers of Science
The erbB family of Receptor Tyrosine Kinases EGF – erbB1 Neuregulin – erbB3/4 No ligand for erbB2 Overexpression (and/or mutation) cancer erbB1 domain structure
The erbB signaling network from Yossi Yarden
Domain II EGFR (erbB1/HER1) + EGF Domain I EGF EGF Domain III dimerization loops Domain IV 1ivo H.Ogiso et al., Cell, 110, 775-787 ( 2002)
QDs make it possible to monitor protein dynamics in live cells… EGF-QD Gur and Yarden Nature Biotechnology 22:169 (2004) Biotinylated-EGF + Streptavidin QDs = EGF-QD
Quantum Dots • Broad excitation spectrum • Narrow emission band • Brightness • Photostability • Single molecule sensitivity • Bioconjugates (Streptavidin, Protein A, IgG...) • Non-toxic • Donors for FRET Biomolecule (SA) Polymer Coating Passivation Shell (ZnS) Semiconductor Nanocrystal (CdSe) Commercial sources: Quantum Dot Inc., Evident Technologies
erbB2 Monitor EGF binding and internalization in living cells using a combination of Visible Fluorescent fusion proteins and Quantum Dot-labeled ligand. erbB1 VFP
Live cell activation by EFF-QD function as “single-molecule” multivalent ligands No non-specific binding Binding leads to uptake Binding leads to activation
Internalization of EGF-QD by erbB1-eGFP CHO cells • Add EGF-QDs during imaging • Binding of EGF-QDs induces membrane ruffling and EGF-QD-erbB1 internalization
Kinetics of EGF-QD Binding and Internalization Binding at plasma membrane reaches a steady-state Internalization continues linearly with time Internalization through clathrin coated pits is rate-limiting step.
erbB3-mCitrine A431 cells • The EGF-QD binds to the endogenous erbB1 and is internalized • The erbB1-EGF-QD moves down the filopodia • The erbB3 remains on the cell surface – it is not internalized with the erbB1
Detection of Hetero-association Does erbB2 or erbB3 internalize with EGF activation of erbB1? A431-erbB1-eGFP High Colocalization Red Green A431-erbB3-mCitrine Low Colocalization Red Green
Quantification of Hetero-association VFPnorm/QDnorm A431-erbB2-mYFP + 2C4 CHO-erbB1-eGFP A431-erbB1-eGFP A431-erbB2-mYFP A431-erbB3-mCitrine ErbB2, but not ErbB3, co-internalizes with ErbB1 upon EGF activation
Retrograde Transport ErbB1-eGFP Merge EGF-QD
What is the transport machinery? Coupled to retrograde flow of actin (treadmilling) Welch et al.Curr. Opin. in Cell Biol. 9: 54 (1997) Active transport by a motor protein (Myosin VI) HassonJ. Cell Science116: 3453-3461 (2003)
Retrograde Transport A431 cell expressing erbB1-GFP (green) after addition of EGF-QD (red)
Tracking Retrograde Transport Track loci over time using the “5D Viewer” (Image J plug-in developed by Dr. Rainer Heintzmann) or Matlab/DIPimage routine, which calculates the center of intensity in a region around the maximum in each time step
Typical MSD plots of QD-EGF-ErbB1 retrograde transport on A431 cells under different conditions Normal Nocodazole (microtubule disruption) Cytochalasin D (actin disruption) PD153035(erbB1 kinase inhibitor) MSD = 4D(Δt) + v2(Δt)2 MSD (pixels2 = 0.01 µm2) D time (s) These plots can be fit to determine diffusion coefficients and velocities...
active transport +EGF diffusion Isolated EGF-QD-erbB1 complexes do not transport 10 nm A431 cells expressing erbB1-eGFP Room temperature 5 pM EGF-QD Excess unlabeled EGF added after 300 s
Minimum requirement for transport is a liganded dimer EGF-QD525 (green) and EGF-QD605 (red) are added simultaneously to A431 cells at room temperature. Single molecule sensitivity When imaged with a CCD camera. One green QD and one red QD are seen to merge and then transport together.
EGF-QDs bind • ErbB1 undergoes conformational change • Stable homodimers form • Activation (P) leads to binding of adapter protein (blue box) • Active receptors are transported to the cell body • Internalization occurs at the base of filopodia Filopodia serve as sensory organelles for the cell by probing for the presence and concentration of growth factors far from the cell body, coupling remote sensing to cellular response via directed transport of activated receptors. Lidke et al., JCB170:619 (2005)
Department of Molecular Biology Max Planck Institute for Biophysical Chemistry Göttingen, Germany • Thomas Jovin, Director • Donna Arndt-Jovin, Group Leader • Keith Lidke • Bernd Rieger • Peter Nagy • Janine Post • Rainer Heintzmann