Clustering (Chap 7)
Clustering (Chap 7). Algorithms and applications. Introduction. Clustering is an important data mining task. Clustering makes it possible to “almost automatically” summarize large amounts of high-dimensional data.

Clustering (Chap 7)
E N D
Presentation Transcript
Clustering (Chap 7) Algorithms and applications
Introduction Clustering is an important data mining task. Clustering makes it possible to “almost automatically” summarize large amounts of high-dimensional data. Clustering (aka segmentation) is applied in many domains: retail, web, image analysis, bioinformatics, psychology, brain science, medical diagnosis etc.
Key Idea • Given: (i) a data set D and (ii) similarity function s Goal: break up D into groups such that items which are similar to each other end in the same group AND items which are dis-similar to each other end up in different groups. • Example: customers with similar buying patterns end up in the same cluster. • People with similar “biological signals” end in the same cluster. • Regions with similar “weather” patterns.
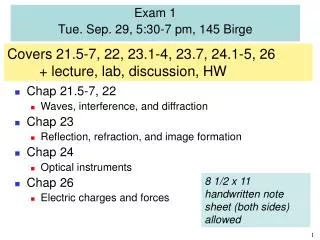
Clustering Example: Iris Data • Iris data set is a “very small” data set consisting of attributes of 3 flower types. • Flower types: Iris_setosa; Iris_versicolor; Iris-virginica • 4 attributes: sepal-length; sepal-width; petal-length; petal-width • Thus each flower is “data vector” in a four-dimensional space. The “fifth” dimension is a label. • Example: [5.1,3.5,1.4,0.2,iris-setosa] • It is hard to visualize in four-dimensions!
Example Iris Data Set Which is the “best” pair of attributes to distinguish the three flower types ?
Attributes and Features • In almost all cases the labels are not given but we can acquire attributes and construct new features. • Notice the terminology: attributes, features, variables, dimensions – they are often used interchangeably. • I prefer to distinguish between attributes and features. • We acquire attributes and construct features. Thus there are finitely many attributes but infinitely many possible features. • For example, Iris data set had four attributes. Lets construct a new feature: sepal-length/sepal-width.
Similarity and Distance Functions • We have already seen the cosine similarity function. • sim(x,y) = (x.y)/||x||||y|| • We can also define a “distance” function which in some sense is like an “opposite” of similarity. • Entities which are highly similar to each other have a small distance between them; while items which are less similar have a large distance between them. • Example: dist(x,y) = 1 – sim(x,y) • “identical” objects: sim(x,y) = 1 dist(x,y) = 0 • sim(x,y) = 0 dist(x,y) = 1
Euclidean Distance Take two data vectors d1 and d2 D1 = (x1,x2,…,xn) D2 = (y1,y2,…yn) Then Euclidean Distance between D1 and D2 is
Euclidean Distance: Examples • D1=(1,1,1); D2=(1,1,1) • dist(D1,D2) = 0 • D1=(1,2,1); D2= (2,1,1)
Simple Clustering:One-dimensional/one-centroid Three data points: 1,2 and 6 Want to summarize with one point The average of (1,2,6) = 9/3 = 3 3 is called the centroid 6 1 2 3
High-Dimensional/one-centroid Let (2,4), (4,6) and (8,10) be three data points in two dimensions. The average (centroid) is:
Different interpretation of centroid Let x1, x2, x3 be data points. Define a function f as: Now, it turns out that the minimum of the function f occurs at the centroid of the three points. This interpretation can be easily be generalized across dimensions and centroids.
High-dimension/many centroids Let X be a set of d-dimensional data points (data vectors). Find k data points (not necessarily in X, lets call them cluster centers), such that the sum of the square Euclidean distances of each point in X to its nearest cluster center is minimized. This is called the K-means problem. The data points which get assigned to their nearest cluster center end up as the k-clusters.
K-means algorithm Let C = initial k cluster centroids (often selected randomly) Mark C as unstable While <C is unstable> Assign all data points to their nearest centroid in C. Compute the centroids of the points assigned to each element of C. Update C as the set of new centroids. Mark C as stable or unstable by comparing with previous set of centroids. End While Complexity: O(nkdI) n:num of points; k: num of clusters; d: dimension; I: num of iterations Take away: complexity is linear in n.
An important question ? • Does the K-means algorithm “solve” the K-means problem. • Answer: only partially. • In fact nobody has yet been able to design an algorithm to “solve” the K-means problem. • Part of the “P =\= NP” problem. • A million dollar prize if you have a “solution” or show that the “solution” cannot exist.
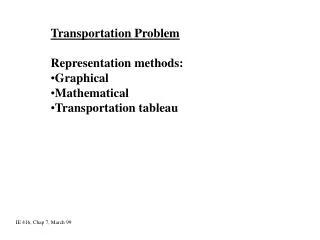
Example: 2 Clusters A(-1,2) B(1,2) c c 4 (0,0) C(-1,-2) D(1,-2) c c 2 K-means Problem: Solution is (0,2) and (0,-2) and the clusters are {A,B} and {C,D} K-means Algorithm: Suppose the initial centroids are (-1,0) and (1,0) then {A,C} and {B,D} end up as the two clusters.
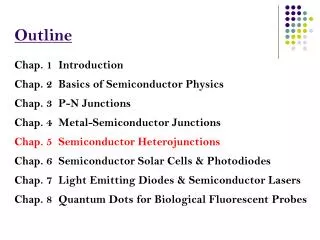
Kmeans algorithm on Iris Data Note: The K-means algorithms does not know the labels!
Kmeans in Matlab • In the tutorial you will be working with Matlab • Matlab is a very easy to use data processing language • For example, the K-means algorithm can be run using one line >> [IDX,C]= kmeans(irisdata,3); The cluster labels (1,2,3) are stored in the variable IDX.
Summary • Clustering is a way of compressing data into information from which we can derive “knowledge” • The first step is to map data into “data vectors” and then use a “distance” function. • We formalized clustering as a K-means problem and then used the K-means algorithm to obtain a solution. • The applications of clustering are almost limitless. • Almost every data mining exercise begins with clustering – to get initial understanding of the data.