Download
1 / 77
780 likes | 963 Vues
"Boost Your Presentation Skills! (and keep your audience coming back for more)" training material presented several times to business and technology audiences, March-May 2013

E N D
Boost Your Presentation Skills! (and keep your audience coming back for more) Marc Jadoul 1 All rights reserved ©2013
Disclaimer This is a training course, not a public presentation. Some of the techniques introduced are not applicable to or are not used in the following slides. 2 All rights reserved ©2013
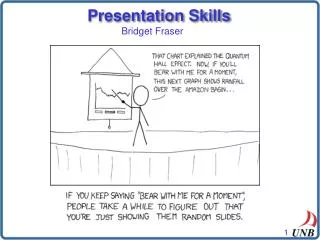
“Death by PowerPoint” 3 All rights reserved ©2013
http://www.youtube.com/watch?v=KbSPPFYxx3o 4 All rights reserved ©2013
The Rise of the Corporate Storyteller Even though millions of us are now content producers in some form or another, the reality is there's still chasm when it comes to quality. There's art and there's junk. Audiences want art. To stand out today it's critical that businesses create content. Activating your cadre of internal subject matter experts is the surest path to visibility. The reality is, however, that organizations need to do more than just unleash their subject matter experts en masse. They need to activate them in multiple channels at once and equip them in how to create a compelling narrative—an emerging set of skills called Transmedia Storytelling. Transmedia storytelling is the future of marketing. And those who can span across formats and share their expertise will stand out in an age of Digital Relativity. Steve Rubel, October 2010 5 All rights reserved ©2013
Why tell stories? • Because we are all human beings • Stories make your content personal and sparkle curiosity • Storytelling is cooperative learning • An entertaining way to transmit a message • It’s a means to stimulate higher level thinking • We tend to forget lists and bullet points • Stories give us permission to act • They allow us to remember the things told • Stories spread. Good stories spread faster… 6 All rights reserved ©2013
When storytelling gets the message across more effectively, its incremental cost is (close to) zero, but its ROI is massive. 7 All rights reserved ©2013
About me… 8 All rights reserved ©2013
message YOUR STORY YOUR SLIDES YOU audience delivery YOUR PRESEN- TATION 9 All rights reserved ©2013
message YOUR STORY YOUR SLIDES YOU audience delivery YOUR PRESEN- TATION 10 All rights reserved ©2013
Great stories succeed because they are able to capture the imagination of large or important audiences. Seth Godin 11 All rights reserved ©2013
The 7 C’s of a good story C ompelling C redible C oncrete C lear C onsistent C ustomized C onversational 12 All rights reserved ©2013
Nobody cares about your products (except you). 13 All rights reserved ©2013
People will forget your words, people will forget your slides, but they will never forget how you made them feel. Maya Angelou http://www.youtube.com/watch?v=jv98mKgWpZ0 14 All rights reserved ©2013
The triune brain ‘Mammal’ (paleopallium) Emotion, seek pleasure, avoid pain ‘Rational’ (neopallium) Logic and thinking 3 2 1 ‘Reptile’ (archipallium) Survival, fear http://en.wikipedia.org/ wiki/Triune_brain 15 All rights reserved ©2013 All rights reserved ©2013
The left and the right brain Function Design Argument Story Focus Symphony Logic Empathy Seriousness Play Accumulation Meaning Daniel Pink, “A Whole New Mind” 16 All rights reserved ©2013
Aristotle’s ancient art of rhetoric Credibility • Trustworthiness or reputation • Tone/style Ethos • Reasoning or argumentation • Facts, figures, case studies • Emotional or imaginative impact • Stories Pathos Logos Logic Emotion http://sixminutes.dlugan.com/ethos-pathos-logos/ 17 All rights reserved ©2013
Making the simple complicated is a common practice; making the complicated simple, awesome simple, that’s creativity. Charles Mingus 18 All rights reserved ©2013
The KISS principle K eep I t S imple, S tupid http://en.wikipedia.org/wiki/KISS_principle 19 All rights reserved ©2013
Even for engineers http://natgeotv.com/uk/engineering-connections http://www.youtube.com/watch?v=tyluS4TZKhQ 20 All rights reserved ©2013
What makes a good storyline? A ttention I nterest D esire E vidence ) A ction ( 21 All rights reserved ©2013
Plan your story • Think about the story you want to tell and the messages you want to convey before you start creating slides • Clearly identify your objectives and expected outcomes • Inform yourself about the opportunity, context, audience, other speakers, etc. • Look for anecdotes, case studies, experience, … • Always start with the end in mind 22 All rights reserved ©2013
Map your ideas http://www.mindmapinspiration.com 23 All rights reserved ©2013
Satisfy your audience’s goals W hat’s I n I t F or M e? 24 All rights reserved ©2013
Know your target audience to tailor your presentation • Size and composition • Key persons in the room • Expectations and level of knowledge • Objectives and level of interest/resistance • Possible questions they may ask • Level of understanding speaker’s language • Overall agenda and time available 25 All rights reserved ©2013
Build a message house Umbrella statement (vision, mission, value, …) Core message perception proposition differentiation relevance Core message perception proposition differentiation relevance Core message perception proposition differentiation relevance Foundation (trends, facts & figures, …) Burson-Marsteller, 2006 26 All rights reserved ©2013
Do the elevator test • Can you “sell” your message in 30 seconds? • Can you summarize it on the back of a napkin or business card? • Can you deliver your story in half of the available time slot? • Can it be understood by your mother in law? http://en.wikipedia.org/wiki/Elevator_pitch 27 All rights reserved ©2013
message YOUR STORY YOUR SLIDES YOU audience delivery YOUR PRESEN- TATION 28 All rights reserved ©2013
If information is presented orally, people remember about 10% of the content 72 hours later. That figure goes up to 65% if you add a picture. John Medina (2008), “Brain Rules” 29 All rights reserved ©2013
The average business presentation has 25% less slides than 3 years ago. Less time to monologue More time to dialogue 30 All rights reserved ©2013
You’ll probably present less than 20% of all the information you have in mind 31 All rights reserved ©2013
What annoys audiences about PPT Presentations? • The speaker read the slides to us • Text so small I couldn’t read it • Full sentences instead of bullet points • Slides hard to see because of color choice • Overly complex diagrams or charts 27.9% 69.2% 48.2% 48.0% 33.0% http://www.thinkoutsidetheslide.com/articles/annoying_powerpoint_survey_2009.htm 32 All rights reserved ©2013
Do not overload your presentation with visuals - they should underline something in your presentation, and not overshadow you, the speaker. 33 All rights reserved ©2013
Great speakers may use poor visuals … … or even no slides at all … Gary Vaynerchuk 34 All rights reserved ©2013
The KILL principle K eep I t L arge & L egible 35 All rights reserved ©2013
Your brain interprets every letter as a picture so wordy slides literally choke your brain. 36 All rights reserved ©2013
Beware of creating ‘slidumentation’. Create visuals to present a solution or to make a statement, not to solve your problem or to document the details. 37 All rights reserved ©2013
Your audience is only capable of holding three or four points in short term memory: respect the ‘rule of three’. 38 All rights reserved ©2013
Only mention the essential figures. Put the rest in a separate handout. 39 All rights reserved ©2013
Plan your presentation • Create a storyboard • Look for appropriate visual materials • Preparation time = 3x presentation time • Background ‘material’ = 5x presentation content • Count 2-3 minutes per slide • Anticipate to possible questions • Re-iterate your slides after each presentation 40 All rights reserved ©2013
Create a storyboard • Start from your mind map • Spend time in the “slide sorter” 41 All rights reserved ©2013
How many slides will you need? (3 mins. per slide) ÷3 Speaking slot (in minutes) Speaking time (in minutes) < x0.8 Number of slides < (Q&A) ÷2 (2 mins. per slide) 42 All rights reserved ©2013
Keep consistent in style, vocabulary, color palette, etc. 43 All rights reserved ©2013
Use appropriate fonts http://www.huffingtonpost.co.uk/2012/07/04/higgs-boson-discovery-comic-sans_n_1648494.html 44 All rights reserved ©2013
Fonts and typefaces • Must be readable from the back of the room • Title 28–36 pts; body text 20-28 pts • Don’t mix too many fonts; don’t use script fonts • Use Bold, italic and color instead of underline • Don’t mix too many colors on one slide • Colors should contrast with the background • Avoid using red text on a white or black background 45 All rights reserved ©2013
Bullets and numbering • Only 1 point or idea per slide • Use statements instead of sentences • Use key words to help audience focus • Title contains 5 words or less • Maximum 7 lines per slide, 7 words per line • Each statement starts with a capital • Avoid numbered bullet lists 46 All rights reserved ©2013
Tables and charts • Avoid large tables and spreadsheet objects • Use appropriate chart types (bar, pie, line, …) • Though charts have a higher visual impact, tables may display information in a less emotional way 47 All rights reserved ©2013
http://www.visual-literacy.org/periodic_table/periodic_table.html 48 48 All rights reserved ©2013 COPYRIGHT © 2013 M. JADOUL. ALL RIGHTS RESERVED.
Clip art and animation • Use illustations wisely • Images must enhance or clarify the content • Scale down photo resolution • Don’t use “fly in” bullets • Limit object builds and slide animation 49 All rights reserved ©2013
Don’t use standard PowerPoint clipart 50 All rights reserved ©2013