Download

1 / 44
440 likes | 464 Vues
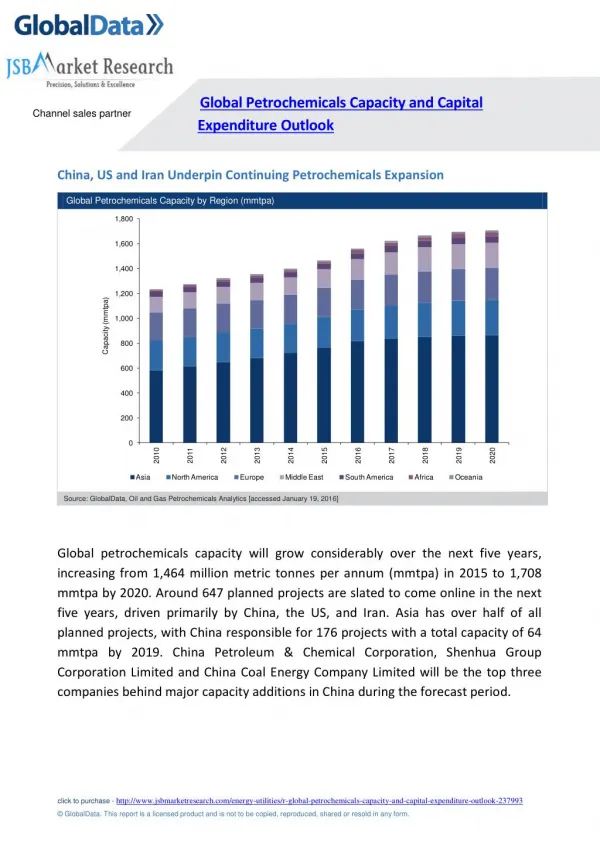
Explore the water demand growth forecast, augmentation and renewal plans up to 2037, and the capital budget for supply systems. Learn about historical trends, future projections, and strategies for managing demand.

E N D
16 October 2017 Presenter: Anthony Els Tariff Consultation Capital Expenditure Programme
SECTION CONTENT Demand growth forecast 2. Augmentation & Renewal plan to 2037 3. Capital budget
Potable Demand Snapshot 4 metros = 83% of demand
Potable Demand • Potable water users • Municipalities • Mines • Direct Users • Historical growth • AADD increase from 1000 Mℓ/d in 1965 to 4084 Mℓ/d in 2016/2017 • Several decades of growth in the 3% to 6% per annum range • AADD Growth from 2007 to 2017 averaged ~2.4% • Currently at ~2%
Demand Growth Forecast • Current growth • Currently at ~2% (was negative last year during restrictions) • Projected growth • After compiling and correlating data, a decline is seen in both ‘natural’ population growth and inward migration: • Medium term growth of 1.80% p.a. • By 2035 a growth rate of 1.25% p.a. • Growth may level off by about 2070 (0%)
Identical growth gradient Possible future abstraction licence Scenario 1: growth as per Infrastructure Planning Projection (no WDM) Scenario 2: Demand progressively reduced 7.5% Historical Abstraction Current proposed abstraction licence Scenario 3: Demand quickly reduced By 15% for 5 – 8 years, before growing again (currently mainly due to 2016 restrictions: WDM only partially contributed to low 2016/2017 AADD)
Response to limited raw resources • Integrated Vaal River System (IVRS) Project 1600 • Committee to establish common ground on usage and abstraction (RW, DWS, SALGA, COGTA) • Water conservation. • Measurement: RW statistical model • Problem area indication • RW sets up and monitors demand targets for RW users; • Develops and implements appropriate protocols for: • Medium term: compliance with abstraction limit of 1600 m³/annum set by DWS until 2025 (until Lesotho Highlands Ph II). • Shorter term drought and emergency situations, using a phased approach • Monthly target monitoring: • Measurement shows that 3 months into the year, customers are cumulatively 5% over ttl. license target. • There is currently no contractual enforcement….
Response to limited raw resources • Water Demand Management efforts (medium term) • Municipal WDM focuses on municipal delivery infrastructure (closing gaps on unaccounted-for water). However: • Acknowledgement of - and action on - high night flow areas required • Abnormally high household leaks need fixing in homes. • Municipalities are currently required to have WDM plans • Rand Water have not yet seen a reduction in projected growth based purely on WDM efforts. Much better results were seen during restriction periods: • Emergency actions; short term; when required: • Phase 1: Notify municipalities to reduce minimum night flows (MNF) • Phase 2: RW assists distressed RW bulk systems from other RW systems • Phase 3: RW intervention: restrict top 25 meters by quantity (may change to top 25 meters, prioritized by least efficient recent water usage)
Knock-on effects of restricting growth • Actively reducing demand growth reduces income stream • Fixed costs remain = a less efficient operating model • Slower growth requires reactively slowing the augmentation programme as follows: • Long lead time large projects currently underway would be completed • Several future projects identified for deferral. However: • Some augmentation projects are required to facilitate renewal. These projects cannot be slowed. • In 95% of renewal project cases, deferral is not an option: renewal completion dates are based on condition, not demand growth • Cutting capital spending has consequences: if growth resumes, it takes time to get capital projects back on track
SECTION CONTENT Demand growth forecast 2. Augmentation & Renewal plan to 2037 3. Capital budget
Supply systems for Planning Note: Primary = Raw Water + Vereeniging + Zuikerbosch Rand Water Eikenhof Supply System Zwartkopjes Supply System Palmiet Supply System Mapleton Supply System Booster Systems Primary Systems Vereeniging Purification System Zuikerbosch Purification System Raw Water Supply System
City of Tshwane Palmiet system Supply systems Eikenhof system Mapleton system Zwartkopjes system Primary systems Vaal Dam
Corporate Systems Booster Primary 200km
Required Augmentation Northern Jhb Tshwane Madibeng Central Jhb Southern areas Eastern Tshwane Ekurhuleni Mpumalanga North west Jhb West Rand Rustenburg • Zwartkopjes system 300 Mℓ/d growth • Palmiet system 600 Mℓ/d growth • Eikenhof system 400 Mℓ/d growth Primary (refurb) • Mapleton system 300 Mℓ/d growth Primary • Primary systems 1600 Mℓ/d growth Primary
Augmentation & Renewal Planning • Augmentation: Increase capacity to meet future demands • 20 year view of projects based on long term view of demands • Renewal: Asset management approach • Operate and maintain asset; • Monitor asset condition; • Refurbish and extend life of existing asset when appropriate; • Replace when economical and if condition merits it • Integration of augmentation and renewal • Renewal and augmentation can facilitate each other (e.g. pipelines) • Integrated at plant, site and system level
Asset Portfolios Buildings and property Civil structures Pipelines Mechanical Electrical Process Automation
Infrastructure Augmentation Providing for 2015 to 2030 augmentation cycle
The Primary systems Northern Jhb Tshwane Madibeng Central Jhb Southern areas Eastern Tshwane Ekurhuleni Mpumalanga North west Jhb West Rand Rustenburg • Zwartkopjes system 300 Mℓ/d growth • Palmiet system 600 Mℓ/d growth Primary (refurb) • Eikenhof system 400 Mℓ/d growth • Mapleton system 300 Mℓ/d growth Primary • Primary systems 1600 Mℓ/d growth Primary
The Primary systems Overview • Growth in demand • Increase of 1600 Mℓ/d from 2015 to 2030 • Key augmentation projects • Station 5 at Zuikerbosch “anchor project” (1200 Mℓ/d in two phases) • BG3 (complete). • BG4, Canal 2 & Forebay in future • B19 raw water pipeline from Lethabo to Vg (nearing completion) • Lethabo pipe header upgrade • Panfontein Drying Beds Phase 2 • Key renewal projects • Vg Engine Room 4 upgrade • 250 Ml/d Sedimentation Tank at Vg • Vg Chlorine plant 2 • Zb Filter House 1 renewal • Zb Chlorine Plant 4 renewal
Primary Systems – 1600 Mℓ/d growth from 2015 to 2030 Additional Purification Plant – 1200 Mℓ/d capacity Additional raw water pipelines and purification plant upgrades Vg Sed Tank R250 million over next 5 years (renewal) B19 raw water pipeline R10 million budget for 2016/17 Station 5 at Zuikerbosch 1200 Mℓ/d capacity in two phases R1 910 million budget over 5 yrs: aug Panfontein Drying Beds R490 million over next 5 years (augment)
The Palmiet system • Augmenting for 2015 to 2030 cycle • Projected growth in peak day demand = 600 Mℓ/d over 15 years Northern Jhb Tshwane Madibeng Central Jhb Southern areas Eastern Tshwane Ekurhuleni Mpumalanga North west Jhb West Rand Rustenburg • Zwartkopjes system 300 Mℓ/d growth • Palmiet system 600 Mℓ/d growth • Eikenhof system 400 Mℓ/d growth Primary (refurb) • Mapleton system 300 Mℓ/d growth Primary • Primary systems 1600 Mℓ/d growth Primary
The Palmiet system Overview • Main customers • Eastern and Northern Johannesburg • Central, Western and Northern Tshwane • Western Ekurhuleni • Growth in demand • Increase of 600 Mℓ/d from 2015 to 2030 • Key augmentation projects • Zuikerbosch to Palmiet B17 pipeline (in commissioning) • Engine Room 3b at Palmiet pumping station • Germiston to Lombardy O6 pipeline • Klipfontein to Brakfontein H39 pipeline • Brakfontein-Lyttleton Heights H43 (and H14 pipeline) • Kensington to Yeoville pumping station • Key renewal projects • O2 Pipeline and O1/G25 • Palmiet Engine Room 1 upgrade • B6 refurbishment
Palmiet System – 600 Mℓ/d growth from 2015 to 2030 Additional Engine Room – 600 Mℓ/d capacity Total of 150 km of pipe between 600 mm and 2100 mm diameter H43 Brakfontein – Lyttleton R724 million in next 5 years (aug) O6 Germiston to Lombardy R460 million in next 5 years (aug) H39 Phase 2: Dale Road to Modderfontein R350 million in next 5 years (aug) Kensington – Yeoville system R400 million in next 5 years (aug) B6 Renewal: R240 million over 5 years (renewal) Engine Room 3b at Palmiet 600 Mℓ/d operational capacity (aug) R 10 million in 2018 (commission) G37/H37 B17 (commission in 2017) Zuikerbosch Purification & Pumping Station
The Mapleton system • Augmenting for 2015 to 2030 cycle • Projected growth in peak day demand = 300 Mℓ/d over 15 years Northern Jhb Tshwane Madibeng Central Jhb Southern areas Eastern Tshwane Ekurhuleni Mpumalanga North west Jhb West Rand Rustenburg • Zwartkopjes system 300 Mℓ/d growth • Palmiet system 600 Mℓ/d growth • Eikenhof system 400 Mℓ/d growth Primary (refurb) • Mapleton system 300 Mℓ/d growth Primary • Primary systems 1600 Mℓ/d growth Primary
The Mapleton system Overview • Main customers • Central and eastern Tshwane • Eastern Ekurhuleni • Growth in demand • Increase of 300 Mℓ/d from 2015 to 2030 • Key augmentation projects • Zuikerbosch – Slangfontein B16 pipeline • Engine Room 3 at Mapleton pumping station • S4 Van Dyk Park to Vlakfontein pipeline • Vlakfontein Reservoir 200Mℓ • Bronberg Reservoir 100Mℓ • R5 Vlakfontein to Mamelodi pipeline • Key renewal projects • Mapleton disinfection plant • M1 pipeline replacement
The Mapleton system Mapleton System 100Mℓ Bronberg Reservoir R124 million over next 4 yrs (aug) R5 Vlakfontein, Mamelodi R432 million over next 4 yrs (aug) 200Mℓ Vlakfontein Reservoir R330 million over next 5 yrs (aug) S4 Van Dyk Park - Rynfield R468 million over next 5 yrs (aug) 210Mℓ Brakpan Reservoir R134 million over next 5 yrs (aug) M1, M6 replacement R237 million over next 5 yrs (renew) N1 Selcourt - Wildebeestfontein R300 million over next 5 yrs (renew) B16 Zuikerbosch - Slangfontein R570 million over next 5 yrs (aug) Engine Room 3 at Mapleton R660 million over next 5 yrs B16 Zuikerbosch – Slangfontein system
The Eikenhof system • Augmenting for 2015 to 2030 cycle • Projected growth in peak day demand = 400 Mℓ/d over 15 years Northern Jhb Tshwane Madibeng Central Jhb Southern areas Eastern Tshwane Ekurhuleni Mpumalanga North west Jhb West Rand Rustenburg • Zwartkopjes system 300 Mℓ/d growth • Palmiet system 600 Mℓ/d growth • Eikenhof system 400 Mℓ/d growth Primary (refurb) • Mapleton system 300 Mℓ/d growth Primary • Primary systems 1600 Mℓ/d growth Primary
The Eikenhof system Overview • Main customers (includes significant mining use) • Western Johannesburg and Soweto • Far West Rand • Rustenburg • Growth in demand • Increase of 400 Mℓ/d from 2015 to 2030 • Key augmentation projects • F34 Waterval to Weltevreden pipeline • F49 Krugersdorp to Randfontein pipeline • Meredale reservoir 1 x 210Mℓ • Additional Meredale reservoir storage (2 x 100Mℓ) • Key renewal projects • Replace Eikenhof disinfection plant • Replace F18 pipe at Witpoortjie Reservoir • Replace pipework from Moroka to Zuurbekom
The Zwartkopjes system • Augmenting for 2015 to 2030 cycle • Projected growth in peak day demand = 300 Mℓ/d over 15 years Northern Jhb Tshwane Madibeng Central Jhb Southern areas Eastern Tshwane Ekurhuleni Mpumalanga North west Jhb West Rand Rustenburg • Zwartkopjes system 300 Mℓ/d growth • Palmiet system 600 Mℓ/d growth Primary (refurb) • Eikenhof system 400 Mℓ/d growth • Mapleton system 300 Mℓ/d growth Primary • Primary systems 1600 Mℓ/d growth Primary
The Zwartkopjes system Overview • Main customers • Northern Emfuleni and Southern Johannesburg • Central Johannesburg (largely developed, low growth expected) • Benoni • Growth in demand • Increase of 300 Mℓ/d from 2015 to 2030 • Key augmentation projects • Amanzimtoti pumping station upgrade • T5 Orange Farm to Ennerdale pipeline • Daleside additional 40 Mℓ reservoir • Arcon Park to Langerand A13 pipeline duplication • Key renewal projects • Replace Vg-Daleside A6 and A8 pipelines • Lay new Zb-Daleside pipe to allow refurbishment of B1 and B2
Balancing and Emergency Storage • Reservoir storage • 20 year plan includes additional 1300 Mℓ reservoir storage • 40% to 50% in Eikenhof system to boost emergency storage • Water quality – total volume, through flow, circulation • Availability of appropriate sites • Projects • “Lower” Meredale reservoirs (and associated pipework) • Daleside 40Mℓ reservoir • Vlakfontein 210Mℓ reservoir • Bronberg 100Mℓ reservoir • Hartebeesthoek additional reservoir • Brakpan 210Mℓ reservoir
SECTION CONTENT Demand growth forecast 2. Augmentation & renewal plan to 2037 3. Capital budget
2018 2037 Augmentation Raw Vg Zb Eik Red projects: timing can be altered to suit WDM success Zks Palmiet Mapleton
2037 2018 Infrastructure renewal Raw Vg Zb Eik Zks Pal Mapleton
5-yearCapital Expenditure (2018 - 2022) forecast of R19.8 billion for continuing business