Download
1 / 20
200 likes | 327 Vues
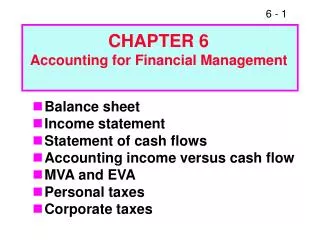
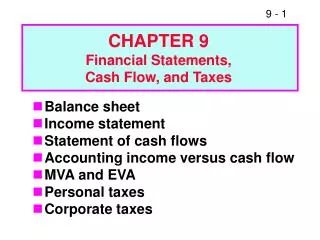
Cash Flow vs. Accounting Income. Project Income Statement Revenues - Depreciation (D) - All other costs EBT - Taxes Project NI (PNI) Cash flow = PNI + Noncash expenses = PNI + Depreciation. Cash Flow Time Line.

E N D
Cash Flow vs. Accounting Income • Project Income Statement • Revenues • - Depreciation (D) • - All other costs • EBT • - Taxes • Project NI (PNI) • Cash flow = PNI + Noncash expenses • = PNI + Depreciation
Cash Flow Time Line • 0 1 2 3 4 • CF0 OCF1 OCF2 OCF3 OCF4 • Initial + • Cash Outlay Terminal • Cash Flow • NCF0 NCF1 NCF2 NCF3 NCF4 • Distinguish among: • 1. Initial cash outlay. • 2. Operating cash flows. • 3. Terminal cash flow.
Data on 4 Period Expansion Project • n: 4 Years • Sales Revenues: $60,000,000 per year starting 2007 • Variable Costs: 70% of sales per year • Fixed Costs: $8,000,000 per year • Building: $12,000,000 in 2006 • Depreciation: MACRS - 39 • 2010 Mrkt Value: $7,500,000 • Equipment: $8,000,000 in 2006 • Depreciation: MACRS - 5 • 2010 Mrkt Value: $2,000,000 • Net Working • Capital (NWC): $6,000,000 • Tax: 40% • Cost of Capital • (WACC): 12%
BQC Expansion Project ($000s) • Building ($12,000) • Equipment (8,000) • Increase in NWC (6,000) • Total Investment ($26,000)
Calculating Net Salvage After Tax • 1) Book Value = original value - accumulated depreciation • 2) Capital Gain or (Loss) = selling price - book value • 3) Net Salvage Value After Tax • = selling price - capital gain tax • OR • = selling price + tax savings from book loss • Accumulated depreciation for Building = $1,092,000 • Accumulated depreciation for Equipment = $6,640,000
1. Buy building : cash flow = ( 12,000 ) • 2. Buy machine : cash flow = ( 8,000 ) • 3. Annual tax saving from building depreciation • 4. Annual tax saving from machine • 5. Annual income after tax • 6. NWC • 7. Salvage in year 2010
Accounting Depreciation( Building ) = 1,092 • Accounting Depreciation( Equipment ) = 6,640 • Book value(Building) = 12,000 - 1,092 = 10,908 • Book value (Eqipment)=8,000 - 6,640 = 1,360
BQC Expansion Project • Year 1 2 3 4 • Depreciation • (Building) 1.3% 2.6% 2.6% 2.6% • Depreciation • (Equipment) 20.0% 32.0% 19.0% 12.0%
Time line of consolidated cash flows(000’s) • 2006 2007 2008 2009 2010 • -26,000 6,702 7,149 6,733 23,116 • Payback period: 3.23 Years • IRR: 19.3% versus a 12% cost of capital • MIRR: 17.2% versus a 12% cost of capital • NPV: $5,166
Net Salvage Values - + Total cash flow from salvage value = $8,863,200 + $1,744,000 = $10,607,200
Data on Replacement Analysis • Cost of M1 (10 years ago): $7,500 • Expected Life: 15 years • Salvage: 0 • Depreciation Method: Straight line • Market value (today): $1,000 • Cost of M2 (today): $12,000 • Depreciation Method: MACRS- 3 years • Salvage (at year 5): $2,000 • Increase in Net Working Capital: $1,000 • Increase in Earnings (before tax): $3,000 per • (or decrease in costs) year • Tax 40% • WACC 11.5%
Replacement Analysis Worksheet • 1) Investment Outlay • Cost of new equipment ($12,000) • Net Salvage of old equipment 1,600 • (Market value of old equipment 1,000 • +Tax savings on sale of old equipment 600) • Increase in net working capital (1,000) • Total net investment ($11,400)
Replacement Analysis • Depreciation Machine #1: 7500 / 15 = 500/year • Machine #1 Accumulated Depreciation = • 10 years x 500 = 5000 • 1) Book Value = original value - accumulated depreciation • 2500 = 7500 - 5000 • 2) Capital (Loss) = selling price - book value • (1500) = 1000 - 2500 • 3) Net Salvage Value After Tax • = selling price + tax savings from book loss • 1600 = 1000 + [ 40%(1500)]
Buy Machine #2 • Before Taxes After Taxes • 1) Earnings 3000 1800 • 2) Tax savings • from depreciation • MACRS - 3 on 12,000 (new machine) • Year % $ • 1 33 3960 • 2 45 5400 • 3 15 1800 • 4 7 840 • 5 0 0 • Accum depreciation = 12,000
Replacement Analysis • 5) Results • Payback period: 4.1 years • IRR: 10.1% versus an 11.5% cost of capital • MIRR: 10.7% versus an 11.5% cost of capital • NPV: -$388.77
Capital Budgeting Illustration • I. Data on Proposed New Asset • MACRS class: 3-year • Economic life: 4 years • Price: $200,000 • Freight & installation: $40,000 • Salvage value: $25,000 • Effect on NWC: Increase inventories by $25,000 & • increase A/P by $5,000 • Revenues: $200,000/year (100,000 units at $2/unit) • Costs (excluding depreciation): 60% of sales • Tax rate: 40% • Cost of capital: 10%
Capital Budgeting Illustration • II. Net Investment Outlay (t=0) • Price ($200,000) • Freight & Installation (40,000) • Increase in NWC (20,000) (25,000 - 5,000) • Net outlay ($260,000)
Annual Cash Flows (in ‘000) • Year 0 1 2 3 4 • Total revenues $200.0 $200.0 $200.0 $200.0 • Operating costs • exclude depreciation (60%) 120.0 120.0 120.0 120.0 • Depreciation (next slide) 79.2 108.0 36.0 16.8 • Total costs $199.2 $228.0 $156.0 $136.8 • EBT $ 0.8 ($ 28.0) $ 44.0 $ 63.2 • Taxes (40%) 0.3 (11.2) 17.6 25.3 • Net income $ 0.5 ($ 16.8) $ 26.4 $ 37.9 • Depreciation 79.2 108.0 36.0 16.8 • Net operating cash flows $ 79.7 $ 91.2 $ 62.4 $ 54.7 • Equipment cost ($200) • Installation (40) • Increase in NWC (20) • Salvage value 25 • Tax on salvage value (10) • Return of NWC 20 • Net cash flows ($260.0) $ 79.7 $ 91.2 $ 62.4 $ 89.7 • NPV = -$4.0 < $0 Discuss effects of: • IRR = 9.3% < k Do not accept project. 1. Sunk costs • MIRR = 9.6% < k 2. Opportunity costs • Payback= 3.3 years 3. Externalities