Download
1 / 27
270 likes | 408 Vues
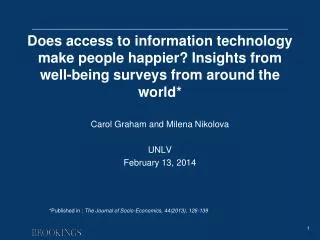
Does access to information technology make people happier? Insights from well-being surveys from around the world*. Carol Graham and Milena Nikolova UNLV February 13, 2014 * Published in : The Journal of Socio-Economics, 44(2013), 126-139. A new science?.

E N D
Does access to information technology make people happier? Insights from well-being surveys from around the world* Carol Graham and Milena Nikolova UNLV February 13,2014 *Published in : The Journal of Socio-Economics, 44(2013), 126-139
A new science? • Until five or so years ago, I was one of a very small number of seemingly crazy economists using happiness surveys, and surely the only one working on developing economies; Today - remarkable interest in the topic; momentum, reflects the work of many academics, and experiments like those of the UK (others) that have taken the science and the metrics seriously; OECD guidelines; NAS panel on metrics for U.S. policy • The “science” of measuring well-being has gone from a nascent collaboration between economists and psychologists to an entire new approach in the social sciences • Can answer questions as diverse as the effects of commuting on well-being, why cigarette taxes make smokers happier, why the unemployed are less unhappy when there are more unemployed people around them, and why people adapt to things like crime and corruption and bad governance.
A new science: the metrics • Method is particularly well-suited for questions that revealed preferences do not answer, such as situations where individuals do not have the agency to make choices and/or when consumption decisions are not the result of optimal choices. • Examples: a) the welfare effects of macro- and institutional arrangements that individuals are powerless to change (macro-economic volatility, inequality) b) behaviors that are driven by norms, addiction or self-control problems such as: i) lack of choice by the poor due to strong norms or low expectations ii) obesity, smoking, and other public health challenges • Two distinct dimensions of well-being (hedonic vs evaluative) – Bentham or Aristotle in the census bureau? • A) Evaluative includes life choices and fulfillment (eudemonia) • B) Hedonic has positive and negative dimensions – e.g. smiling and happy not a continuum with stress or worry
Technology=Progress: Does it Make People Happy? • Exponential growth of access to ICTs worldwide • Information technology is key to economic progress in today’s global economy; provides connectivity, information, agency – but like all development related changes, progress paradox issues • contributions to GDP growth • 10 ppt in broadband penetration => per capita GDP growth by 0.9 – 1.5 pptin OECD for 1996-2007 • 0.1-0.4 percentage growth of GDP due to broadband infrastructure in Europe, 2002-2007 • access to information/communications capacity • access to financial services • mobile banking • Kenya: 18 million mobile money users (75 percent of population) • Provides new capabilities – e.g. agency!
Impact of ICTs on Growth Source: World Bank, 2013, The Transformational Use of Information and Communication Technologies in Africa, p. 21.
Access to ICTs, Sub-Saharan Africa, 2006-2012 Source: Gallup World Poll, 2005-2013
Access to landlines and cell phones, by region, 2009-2011 Source: Gallup World Poll, 2008-2012
Access to internet and TV, by region, 2009-2011 Source: Gallup World Poll, 2008-2012
On your cell phone, do you regularly…?**Asked of those with cell-phones Source: Pew Research Center, 2012
Research questions • well-being effects of the increased access to ICTs around the world? • relationship between well-being and capabilities/agency? • do the effects vary across the well-being dimensions (hedonic vs. evaluative)?
Hypotheses: ICTs and subjective well-being • ICTs are positively correlated with hedonic well-being • ICTs are positively associated with
Data • Gallup World Poll (2005-2012) • annual survey run by the Gallup Organization ~ 140 countries (~ 1,000 respondents per country) • pooled cross-sections • telephone and face-to-face surveys • range of questions • household income, attitudes, hedonic and evaluative well-being • Employment data starting in 2009 • Global Findex Database for 2011 (World Bank) • implemented by Gallup as part of the 2011 World Poll • 148 countries (~ 1,000 respondents per country) • telephone and face-to-face surveys • questions on the use of mobile phones to pay bills, send or receive payments (among others)
ICT variables (focal independent variables) • Does your home have…? • a landline telephone? • a cellular phone? • a television? • access to the Internet?
Main model and estimation Yitr= 1landlineitr + 2cell phoneitr + 3TVitr + 4internetitr + Xitr + Zitr+r + t + itr • i indexes individuals, t denotes time, and r denotes country • Yis subjective well-being • X and Z are vectors with individual and household-level controls • e.g., age, gender, having a child, living in urban/rural area, etc. • c are country dummies and t are year dummies • Estimation: • logits and ordered logits (bpl = 1-10, hedonic vars = 0-1) • country and year dummies • robust standard errors
Summary of regional results • Important differences between poor and wealthy regions • Access to TV and cell phones • A positive correlation with evaluative well-being in Sub-Saharan Africa, Latin America, and Southeast Asia • Not significant in wealthy regions (North America, parts of Europe, Australia and New Zealand • Access to the internet • significant and positive across the world
Do ICTs have differential impacts in poor and rich contexts?
Determinants of learning (a possible channel in the relationship)
Well being and access to mobile banking in Sub-Saharan Africa
Limitations • Reverse causality • possible but unlikely – is it really likely that happier people are more likely to acquire information technology? • Lack of panel data • unobserved heterogeneity • The results may be underestimating the effects of ICTs on well-being • ICT externalities likely apparent at the aggregate and not individual level • Different survey modes across countries • happier on the phone (Dolan and Kavetsos, 2012) • include country dummies – and mode is the same within countries so should control for it
Conclusions: Does tech access enhance well-being? • In general: well-being • positive effects most pronounced in poor contexts • but also stress and anger • Diminishing marginal returns for those with much access • ICTs positively correlated with learning • learning could explain the stress and anger findings • Well-being effects of mobile banking (above and beyond ICTs) • but also stress and anger (progress paradox, again) • Access to ICTs can only complement but not substitute development - the provision of public goods and infrastructure is important • Fits into a broader pattern of our research which shows that the process of acquiring agency/capabilities can have negative effects in the short term, while raising overall well-being levels in the long term – “happy peasants and frustrated achievers”