State and Activity Diagram
100 likes | 211 Vues
State and activity diagrams are essential tools for developers, aiding in the comprehension of complex or unique functionalities within a system. State diagrams illustrate the dynamic behavior of a system, its sub-systems, or individual objects, using various behavioral elements. In contrast, activity diagrams depict the operational workflows, showcasing activities and triggering events for objects in specific states. For instance, an activity diagram could represent the workflow involved in attending a lecture at 8 AM. Both diagrams are crucial for visualizing and understanding system behaviors and interactions.

State and Activity Diagram
E N D
Presentation Transcript
State and Activity Diagram Nyimas Sopiah
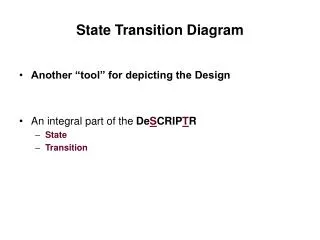
State Diagram • State diagrams (also called State Chart diagrams) are used to help the developer better understand any complex/unusual functionalities or business flows of specialized areas of the system. In short, State diagrams depict the dynamic behavior of the entire system, or a sub-system, or even a single object in a system. This is done with the help of Behavioral elements.
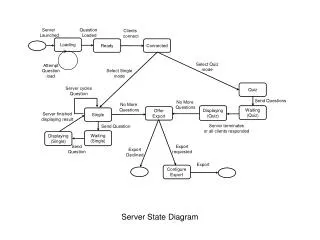
Activity Diagram • Activity diagrams represent the business and operational workflows of a system. An Activity diagram is a dynamic diagram that shows the activity and the event that causes the object to be in the particular state.
Let us consider the example of attending a course lecture, at 8 am.