Download
1 / 30
300 likes | 306 Vues
IUMI 2002 New York City Facts & Figures Committee. Report on Marine Insurance Premium 2000 and 2001. Tore Forsmo The Central Union of Marine Underwriters Oslo, Norway Thanks also to Fédération Française des Sociétés d’Assurances (FFSA) and the International Underwriting Association

E N D
IUMI 2002 New York City Facts & Figures Committee Report on Marine Insurance Premium 2000 and 2001 Tore Forsmo The Central Union of Marine Underwriters Oslo, Norway Thanks also to Fédération Française des Sociétés d’Assurances (FFSA) and the International Underwriting Association of London (IUA)
World Merchant Fleet Reported (*)by Type of Ship m.DWT, Number of ships as at January 1st, 2002 and DWT growth rate 1998-2002 (%)(ships >= 1,000GT)
Key IndicatorsWorld Merchant Fleet Reported by National and Foreign Flagas at Januar1st, 2002 – (ships >= 100 GT) Source: Indicators issued from various sources such as ISL Bremen for the World Fleet and trading figures and Clarkson Research Studies for shipbuilding and demolition
Key IndicatorsWorld Merchant Fleet Reported Top Ten Countries of Managementas at 1 january 2002 – (ships >= 1000 GT) Source: Indicators issued from various sources such as ISL Bremen for the World Fleet and trading figures and Clarkson Research Studies for shipbuilding and demolition
Key IndicatorsWorld Merchant Fleet Reported Evolution of Top Ten Countries of Managementas at January 1st, 1998, 2001, 2002 (Countries >= 20 million DWT) Source: Indicators issued from various sources such as ISL Bremen for the World Fleet and trading figures and Clarkson Research Studies for shipbuilding and demolition
Key IndicatorsWorld Merchant Fleet Reported Top Ten Countries by National and Foreign Flagsas at January 1st, 2002 (ships >= 100 GT) Source: Indicators issued from various sources such as ISL Bremen for the World Fleet and trading figures and Clarkson Research Studies for shipbuilding and demolition
Key IndicatorsOrderbookEvolution by Type of Ship Source: Indicators issued from various sources such as ISL Bremen for the World Fleet and trading figures and Clarkson Research Studies for shipbuilding and demolition
Key IndicatorsDeliveries in 2001by Country of Shipbuilder Source: Indicators issued from various sources such as ISL Bremen for the World Fleet and trading figures and Clarkson Research Studies for shipbuilding and demolition
Key IndicatorsDemolition in 2001by Type of Ship Source: Indicators issued from various sources such as ISL Bremen for the World Fleet and trading figures and Clarkson Research Studies for shipbuilding and demolition
Key IndicatorsWorld Seaborne Trade Volume Development 1970 - 2001million tonnes – (* estimates) Source: Indicators issued from various sources such as ISL Bremen for the World Fleet and trading figures and Clarkson Research Studies for shipbuilding and demolition
Report on marine insurance premiums 2000 and 2001 • By end of August 2002, 44 of 55 members reported their country’s marine premium figures for both accounting years 2000 and 2001. • With two important marine markets having reported for the first time this year, reported figures now represent approx. 97% of the total marine premium written by all IUMI members for both 2000 and 2001. • Total premiums for 2000 is therefore estimated to reach approx. USD 11.3 billion and for 2001 approx. USD 10.9 billion (excluding P&I from mutual P&I Clubs).
Report on marine insurance premiums(USD billions) Global premiums 1999-2001 (as reported per end of August 2002) *Index based on figures from Associations who have reported in both years The index reflects changes in country activity as well as premium increases and is thus not a renewal index! As some countries only report total marine premium without splitting into classes, the sum of these classes might in some cases be slightly less than the ”total” sum.
Report on marine insurance premiums - Breakdown by economic areas(USD million)
Global Hull Premium - Major Markets 1992 - 2001(USD Million)
Global Cargo Premium - Major Markets 1992 - 2001(USD Million)
MARINE MUTUAL MARKET SECTOR STATISTICSGross Calls (Premium) - Fiscal Domicile Per accounting year - USD 1000 Source: Standard & Poors Marine Mutual Report 2002
MARINE MUTUAL MARKET SECTOR STATISTICSGross Calls (Premium) - Operational location Per accounting year - USD 1000 Source: Standard & Poors Marine Mutual Report 2002
Report on marine insurance premiums - Accounting year 2000 (in USD 1000) Comments: NA = split not available, not rep. = country did not report
Report on marine insurance premiums - Accounting year 2000 (in USD 1000) Comments: NA = split not available, not rep. = country did not report
Report on marine insurance premiums - Accounting year 2000 (in USD 1000) Comments: NA = split not available, not rep. = country did not report
Report on marine insurance premiums - Accounting year 2001 (in USD 1000) Comments: NA = split not available, not rep. = country did not report
Report on marine insurance premiums - Accounting year 2001 (in USD 1000) Comments: NA = split not available, not rep. = country did not report
Report on marine insurance premiums - Accounting year 2001 (in USD 1000) Comments: NA = split not available, not rep. = country did not report
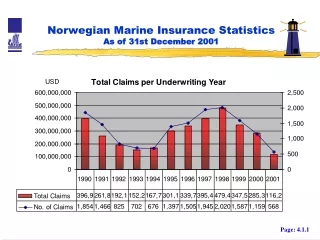
Marine Hull – Evolution of Paid Claims and Gross Premiums per U/W Year 1996 to 2001 (USD) Totals of 6 Member Organisations – France, Germany, Italy, Norway, UK Lloyds, UK IUA (5 for 1996 – No Germany)
Marine Hull – Ladder Table (USD)Totals of 6 Member Organisations France, Germany, Italy, Norway, UK Lloyds, UK IUA (5 for 1996 – no Germany) Premium = Gross Premium Claims = Paid Claims
Transport / Cargo – Evolution of Paid Claims and Gross Premiums per U/W Year 1996 to 2001 (USD) Totals of 8 Member Organisations – Belgium, France, Germany, Italy, Netherlands, Switzerland, UK Lloyds, UK IUA (7 for 1996 – no Germany)
Transport / Cargo – Ladder Table (USD)Totals of 8 Member Organisations in USD – Belgium, France, Germany, Italy, Netherlands, Switzerland, UK Lloyds, UK IUA (7 for 1996 – no Germany) Premium = Gross Premium Claims = Paid Claims