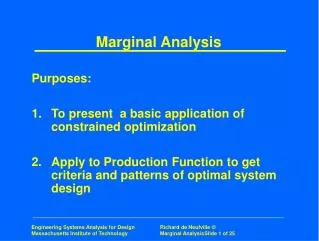
Simple maxim of marginal analysis:
130 likes | 372 Vues
Simple maxim of marginal analysis: Make a “small” move to a nearby alternative if and only if the move will improve one’s objective. Keep moving, always in the direction of an improved objective, and stop when no further move helps. Expand an Activity if and only if

Simple maxim of marginal analysis:
E N D
Presentation Transcript
Simple maxim of marginal analysis: Make a “small” move to a nearby alternative if and only if the move will improve one’s objective. Keep moving, always in the direction of an improved objective, and stop when no further move helps. Expand an Activity if and only if the Extra Benefit exceeds the Extra Cost.
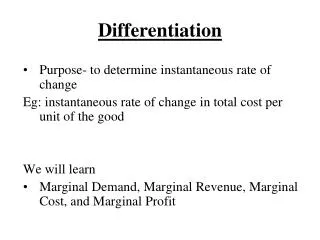
Refresher – Differential Calculus • A derivative is a rate of change (marginal change, slope). • From total cost, the first derivative gives marginal cost (slope at specific point).
Refresher – Differential Calculus Rule 1: The derivative of a constant is zero. Where c is a constant
Refresher – Differential Calculus Rule 2: Power rule (x3)=3x2 (xn)=nxn-1 (5x2)=10x (.5x4)=2x3
THE FIRM’S BASIC PROFITMAXIMIZATION PROBLEM • What Quantity of Output should the Firm • Produce and Sell and at What Price? • Firm produces single good for single market. Objective = profit max. • Must determine quantity and price of good. • Assume firm can predict revenue and cost consequences of price and output decisions with certainty.
MAXIMIZING PROFIT FROM MICROCHIPS F2 Demand equation Q = 8.5 - .05P Write profit as = Revenue - Cost Price ($ 000) Inverse demand equation P = 170 - 20Q 170 130 90 50 Revenue function Rev = P x Q R = (170-20Q)Q = 170Q-20Q2 Quantity in Lots 0 2 4 6 8
Example: Q = 425-1.25P Find inverse demand function Q = 425-1.25P 1.25P = 425-Q P = 340 - .8Q Find revenue function R = PQ R = (340-.8Q)Q R = 340Q - .8Q2
THE FIRM’S OPTIMAL OUTPUT DECISION Profit Max Output where MR = MC. R, C C = 100 + 38Q Fixed costs = 100 Var costs = 38/unit 300 200 100 0 -100 R = 170Q - 20Q2 M= 0 Profit Function = (170Q - 20Q2)-(100 + 38Q) = -100 + 132Q – 20Q2 Q 0 2 4 6 8 3.3
MAXIMIZING PROFIT USING MARGINAL GRAPHS Set MR = MC. 170 P* Demand MC 38 MR Q*
MAXIMIZING PROFITMATH SOLUTIONS • Start with Demand and Cost Information • P = 170 - 20Q and C = 100 + 38Q • Therefore, R = 170Q - 20Q2 • so MR = 170 - 40Q and MC = 38 • Setting MR = MC implies 170 - 40Q = 38 • or 132 = 40Q Q* = 132/40 = 3.3 lots P* = 170 - (20)(3.3) = $104 K * = 343.2 - 225.4 = 117.8
SENSITIVITY ANALYSIS Considers changes in: Fixed Costs, Marginal costs, or Demand Conditions 170 A change in fixed cost has no effect on Q* or P* (because MR and MC are not affected). P* Demand MC 38 Q*
SENSITIVITY ANALYSIS Considers changes in: Fixed Costs, Marginal costs, or Demand Conditions 170 An increase in MC implies a fall in Q and an increase in P. Demand MC’ MC 38 Q’ Q*
SENSITIVITY ANALYSIS Considers changes in: Fixed Costs, Marginal costs, or Demand Conditions Finally, consider a change in Demand Conditions. 170 P* Shift in Demand MC 38