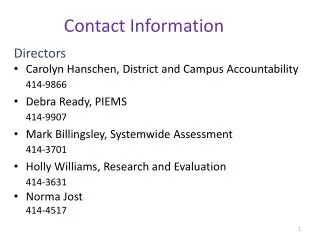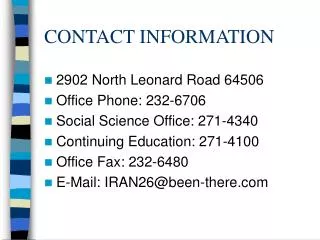
Contact Information
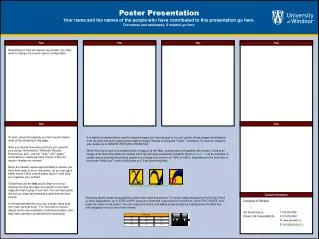
Follow these tips to optimize images in your poster for better printing quality and presentation appeal. Ensure scale is at 25% or lower for optimal printing results.

Contact Information
E N D
Presentation Transcript
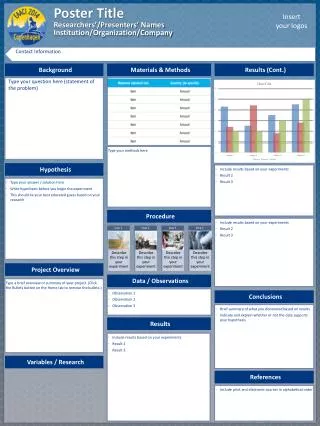
Tips for Inserting Graphs or Images Note: Skip the following procedure if your graphs were created in PowerPoint®, Illustrator (eps file) or Excel. Image checking procedure: After you insert the image (72 dpi screen resolution) and resize* to fit, right click on it and select Format Picture. When the pop-up window comes up, click on size and check thescale. The image will print better if its width and height scale is at 25% or lower (20% or 10%, etc.) If the scale of the image is higher than 25%, try to replace it with a larger size (more dpi, e.g. 300dpi) image if possible. (Note: This should not be done by manually stretching the image to a larger size.) If the resolution of the image is 300 dpi or higher (400 or 600 dpi), then check to make sure its scale is not higher than 100%. *To resize an image – Click on the image, hold the Shift key down and drag the bottom right corner to resize the image in proportion. (Delete this box when inserting your text or image. This is only a reminder.) Poster TitleResearchers’/Presenters’ NamesInstitution/Organization/Company Insert your logos Contact Information Background Materials & Methods Results (Cont.) Type your question here (statement of the problem) Type your methods here Tips for Title/Headers Bar Color How to change the background color for the poster title and headers: Right click on the bar and select Format Autoshape. When the pop-up window comes up, select your color under “Fill” and then “Color” menu. For more effects select Fill Effects under the Color option. (Delete this box when inserting your text or image. This is only a reminder.) Hypothesis • Include results based on your experiments • Result 2 • Result 3 • Type your answer / solution here • Write hypothesis before you begin the experiment • This should be your best educated guess based on your research Procedure • Include results based on your experiments • Result 2 • Result 3 Tips for Excel Charts Copy and paste your Excel chart. The chart can be stretched to fit as required. If you need to edits parts of the chart, we recommend you edit the original chart in Excel, then re-paste the new chart. (Delete this box when inserting your text or image. This is only a reminder.) Project Overview Data / Observations Type a brief overview or summary of your project. (Click the Bullets button on the Home tab to remove the bullets.) • Observation 1 • Observation 2 • Observation 3 Conclusions • Brief summary of what you discovered based on results • Indicate and explain whether or not the data supports your hypothesis Results • Include results based on your experiments • Result 2 • Result 3 Variables / Research References • Include print and electronic sources in alphabetical order