Analysis of Sea Surface Temperature Fronts from Geostationary Satellites
210 likes | 320 Vues
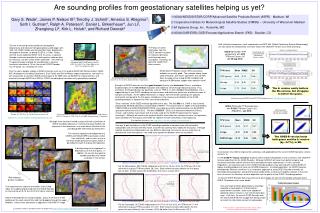
This study focuses on the calculation and analysis of full-resolution hourly sea surface temperature (SST) values using geostationary satellites. It involves remapping SST data onto a 0.05° regular grid, applying a Sobel filter to reduce artifacts such as cloud edges and coastline effects, and generating averaged SST data over 4-day periods. Challenges include determining the best synthesis methods, whether to use gradients or water mass limits, and the potential for operational products. Insights from the Good Hope Cruise in March 2008 are also discussed.

Analysis of Sea Surface Temperature Fronts from Geostationary Satellites
E N D
Presentation Transcript
Fronts from geostationary satellites Richard Legeckis*, Peter Cornillon**, Pierre Le Borgne*** *NOAA, Washington **University of Rhode Island **Météo-France/DP/CMS, Lannion
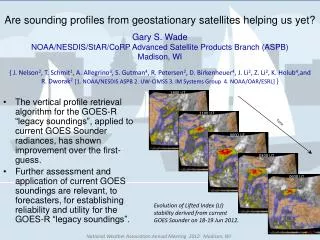
Fronts (Good Hope) • Calculation of full resolution hourly SST values • Remapping over a 0.05° regular grid • Averaging SSTs over 24 hours • Applying a sobel filter • Filtering out the artefacts (cloud edges, coast line,…) • Averaging over 4 days
Rossby eddy Mov-14 • Pc-14 old-short 8A Legeckis & LeBorgne, 2007
Fronts ( Mozambique)towards operational products • Calculation of full resolution hourly SST values • Remapping over a 0.05° grid • Applying Sobel filter to every SST field (median) • Filtering out the artefacts (cloud edges, coast line,…) • Median over N hours to produce daily synthesis • Synthesis over 4 days
9AM to 8PM Tsv filtered
9AM to 8PM Tsv filtered
9AM to 8PM Tsv filtered
9AM to 8PM Tsv filtered
Centered On 0000UTC
open issues • Sobel of averaged SST or synthesis of Sobel? • Synthesis : max, median or filtered? • hourly, daily, 4 daily products? • gradients (Sobel) or water mass limits (Cayula&Cornillon)