Download
1 / 18
180 likes | 194 Vues
This study investigates the influence of biomass burning from Southeast Asia on the Pacific and the associated ozone levels. Utilizing satellite imagery, air quality models, and observation data, the study examines the trajectory and impact of pollutants from biomass burning in Southeast Asia.

E N D
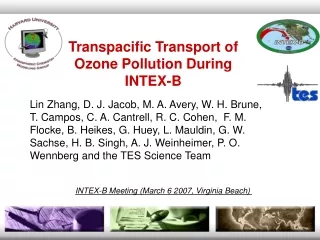
Transpacific transport of biomass burning from Southeast Asia during INTEX-B K. Bowman1, B. Pierce2, J. Al-Saadi2,S. Kulawik1, M. Luo1, Louisa Emmons3, PK Bhartia4, G. Osterman1, J. Worden1, H. Worden1 1Jet Propulsion Laboratory, California Institute of Technology 2NASA Langley Research Center 3National Center for Atmospheric Research 4NASA Goddard Space Flight Center
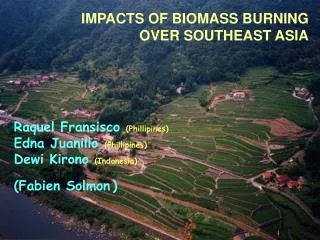
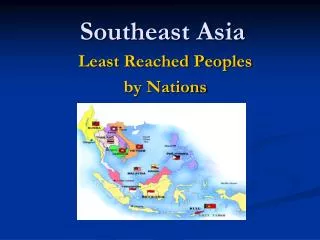
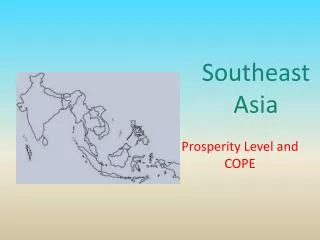
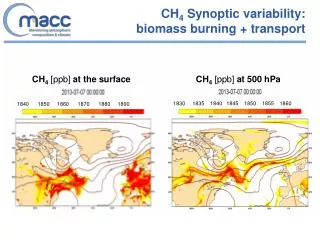
Role of Southeast Asian wildfires (INTEX-B): • What is the influence of biomass burning from Southeast Asia in the Pacific? • How much ozone in the Pacific can be associated with biomass burning?
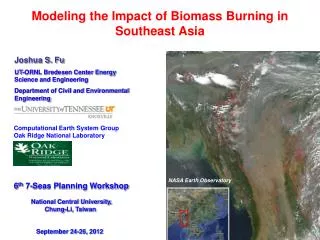
Evidence of biomassburning in Southeast Asia • MODIS (Moderate Resolution Imaging Spectroradiometer) derived firecounts (red-moderate, yellow-high) provide a signature of biomass burning sources • Images taken over 10 day periods from March to April, 2006.
Where are pollutants from biomass going? • The real-time air quality model • (RAQMS) is used to calculate • trajectories from wildfire emission • Production rates • Trajectories from all wildfire • locations are initialized each • Day from April 10-15. • Trajectories are averaged in • 1x1 bins • Wildfire locations calculated from • MODIS firecounts and Haines fire • Index • MOPITT CO columns show enhancements near Thailand and throughout the Pacific
TES Limb View Nadir View Tropospheric Emission Spectrometer TES is a Fourier transform spectrometer specifically designed to measure tropospheric ozone and its precursors • .1 cm-1 spectral resolution (apodized) • 650 to 3050 cm-1 (3.2 to 15.4 microns) • 0.5 x 5 km (nadir) spatial resolution • 3 observation modes • Global survey (72 obs/orbit, 16 orb/day, ~1.3 deg lat) • Step and stare (~.4 deg lat) • Transect (near-continuous) • Estimates vertical profiles from the surface to .01 mb • of temperature, H2O,ozone, carbon monoxide, HNO3 • as well as emissivity, surface temperature, • and effective cloud parameters • Estimates made both for day and night TES global survey and “step-and-stare" mode
TES CO and ozone away from source Averaging kernel indicates sensitivity above cloud cover at 600hPa Enhanced CO coincident with wildfire trajectories at 350 hPa and ~45-50N No concomitant ozone enhancement
RAQMS CO and ozone away from source RAQMS model predict elevated CO from 45-50N at 350 hPa CO enhancement expected based on RAQMS with TES observation operator No enhancements in ozone associated with wildfires is expected based on RAQMS prediction
Influence of wildfires from CO/ozone distributions as seen by TES • Discrepancies are due in part • to a known underestimate of • meridional gradient of CO • background in RAQMS models • Convolution of noise pdf • neglected • The fires occurrences • are consistent between RAQMS and TES • However, TES CO values are higher than RAQMS that • are associated with fires
Summary • 20% of elevated CO (> 180ppb) observed by TES over the Pacific is associated with wildfire emissions, consistent with expected RAQMS distribution • Few ozone enhancements (>100 ppb) are associated with these fires. • Consequently, either ozone production is low in fires and/or ozone is not transported away from source region • Discrepancies between RAQMS and TES attributed to meridional background of CO in RAQMS and co-location of plumes in clouds
TES ozone and CO near source White lines indicates regions of wildfire influence from trajectories CO Enhancements starting from the South China sea through mainland China Weak ozone enhancement within wildfire Trajectories but strong enhancements above Clouds effect sensitivity below 300 hPa From 25-32N and elevation changes sensitivity >40N
RAQMS ozone and CO near source RAQMS indicates strong CO enhancements from 20-40N and that TES is expected to see enhancements from 15-25N Elevated ozone is modeled between 17-22N but is not expected to be observed from TES vertical sensitivities Elevated ozone at 400 hPa in TES observations are not in RAQMS model
How do wildfires contribute to ozone formation and transport? • Ozone production/loss (P-L) rates from the RAQMS model along wildfire trajectories • Production > 1ppb/day (white) are concentrated near source regions • Ozone loss away from sources, suggesting the ozone is reach photoequilibrium • P-L rates are highly dependant on initial NOx
Wildfire influence April 10-24 Wildfire emission rates and ozone production/ loss rates are averaged over West, Central, and East Pacific Most wildfire influenced air parcels are advected northward along the westerlies into the polar jet Ozone production reaches 8 ppbv/day at the source but is confined to lower altitudes High emissions rates are Centered at 20N in the Eastern Pacific and extend up to 500 mb.
Influence of wildfires on Pacific CO/ozone distributions from RAQMS along TES orbits 50% of CO > 150ppbv is due to wildfires only small fraction (10%) of elevated Ozone (~100ppbv) is associated with wildfires. Stratospheric influenced ozone is evident for CO < 50 ppb
Cross-sections of Trajectory mapped wild fire emissions April 10-24, 2006 Wild fire trajectories are binned each day in lat/lon/pressure. The initial wild fire emission rates for each trajectory are averaged in 1x1 degree grid boxes. Then the daily binned trajectory mapped wild fire emissions are time averaged. Figures show time averaged “wild fire influence” for Western, Central, and Eastern Pacific