Download
1 / 23
230 likes | 316 Vues
Utilizing statistical data to inform decision-making, monitor progress, and ensure accountability within the system. Empowering citizens through information dissemination and promoting evidence-based policy development.

E N D
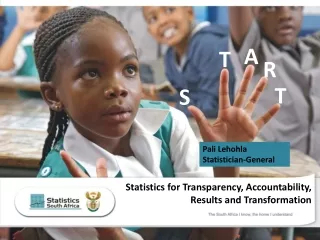
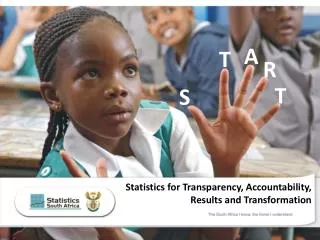
A T R T S Statistics for Transparency, Accountability, Results and Transformation
Mandate • Statistics fulfils a vital role as a decision support system • System of planning – roadmap to achieve long-term goals • System of monitoring and evaluation – to know and understand status of progress against goals and targets • System of evidence and accountability for the state: • Informs planning and policy development • Monitors progress and evaluate performance • Communicate the efficacy of the development agenda • Enable citizens the right/entitlement to participate in democracy • Stats SA has the statutory mandate to: • Produce official statistics • Coordinate the production of official and other statistics within the South African National Statistics System (SANSS) • Disseminate and be guarantor of use
Risk map GDP (1998) Business Register (1998) • What was our response? • Did we act with speed? • Did these risks eventuate? • How have we mitigated these risks? NSS (2001) Risks (2001) CPI basket (2001) ICOTS (2003) SASA (2005) Labour statistics (2006) Geography (2009) Collection methods (2011) Succession (2012) Disseminate (2012) Race discourse (2013) Stats Act (2014) Post 2015 - MDG (2014)
Risks eventuated • CPI debacle in 2003 • Impact: Loss of credibility • Estimated R50 billion to government and R10 billion to private sector CPI basket (2001) Risks (2001) • 2001 – 2005 qualified audit opinions • 2001/02 disclaimer ICOTS & SASA • Failure to impact on maths teaching and appreciation at schools • Levels of statistical competence among Blacks and Coloureds still leaving a lot to be desired Disseminate (2012) • Failure of evidence to reach the audience indirectly leading to: • Public protests • Loss of life • Loss of property • Wrong choices
Strategy map A Better Life for All Impact on Society Economic growth & transformation Healthy life Improved service delivery People are & feel safe Decent jobs Increased use of statistical information as evidence in: Outcome: Evidence for decisions Decision- making Policy development Planning Monitoring & Evaluation Employment Finance Education Transport Statistical products In space Population Mining Agriculture Service Delivery Manufacturing Trade Construction Utilities Businesses processes Statistical production Statistical Coordination & Support Governance & Administration Statistical Frames Invest in learning and growth Technology & Infrastructure Organisation People
Investing in people Schools level (Maths4Stats – training of teachers, Census@School – school curriculum adopted) Tertiary level (KZN, Stellenbosch, Wits, UCT) Inside Stats SA (Internship, e-learning, bursaries, leadership training, statistical training ) Empowering partners in the NSS & Continent (Certificate in official statistics, Statistical methodology)
Governance & Administration Unqualified audit Improved systems, processes & policies (E.g. Invoice Tracking System; ICT governance framework) Integrated planning and reporting (Programme & project planning & reporting) Management systems (Use of Management Performance Assessment Tool) Enterprise risk management (Strategic and Operational risks)
Statistical products Understanding Economic growth & transformation 171 releases 12 releases Mining & Quarrying Manufacturing 18 releases Trade 36 releases 25 releases Business services GDP 17 releases 15 releases Finance Quarterly Construction Annual Electricity, Gas & Water 13 releases 14 releases Transport, storage & communication 25 releases Tourism 1 release Agriculture, hunting, forestry & fishing
Statistical products Understanding Price changes Re-engineered PPI published In 2013 Introduced new CPI methodology in 2009 12 releases Consumer Price Index 12 releases Producer Price Index 12 releases Understanding Employment, Decent work and Job creation Introduced new QLFS methodology in 2008 Quarterly Employment Survey Quarterly Labour Force Survey 4 releases 4 releases Annual Report
Statistical products Understanding Poverty and Service Delivery General Household Survey Countrywide almost 85% of households had access to electricity Non-financial Survey of Municipalities 12 releases 1 Release 3 Release 1 Release Living Conditions Survey 1 Release Income & Expenditure Survey Understanding Education Statistical system: Partnering with Dept of Basic Education Census of Schools (Limpopo & Eastern Cape) Census 2011 General Household Survey Quarterly Labour Force Survey
Statistical products Understanding Health Mortality and Causes of Death 1 Release 12 releases Other Vital statistics 16 releases Tuberculosis has been the leading cause of death over the past 10 years Statistical support to Department of Health Understanding Crime Statistical system: Partnering with SAPS 1 release Victims of Crime Survey • Statistical support to SAPS: • Data quality policy on Crime Statistics • Statistical support and advice • Training in SASQAF 2 reports
Statistical products Census 2011 • Key achievements • Released results: 30 October 2012 (within 12 months) • Various platforms: Roambi, Mobi, other androids, web portal, cd’s, print • Key products: • My Ward, My Councillor • Digital Atlas • My Village, My Suburb (Ikaya) • Umkhanyakude (new data portal)
Statistical coordination Addressing the information gap Census of Schools, data mining , integrative statistical and geographical products, engaging experts and researchers, MDG process Addressing the quality gap SASQAF Statistical support and advice to various organs of state including SAPS, provincial governments, municipalities, Home Affairs, Transport, DPME, Tourism Addressing the skills gap CRUISE, E-learning, training in statistical competencies, training municipalities in use of statistical products
Communicate, Disseminate and Use Communicate Communicated results; created good public awareness of the organisation and products; trained media Disseminate Created various platforms for dissemination to increase access (Umkhanyakude, Roambi etc) Use Developed specialised products (My ward, My Councillor etc) ISIbalo Annual Symposia and ISIbalo Annual Lecture Series
Impact on Society Increased knowledge, understanding and use by the leadership, citizens and state Used in the planning environment? (baseline information for NDP) Used in the monitoring and evaluation environment?(measuring development and impact) Increased statistical literacy? (increasing rationale for making decisions) Results used for transparency and accountability? (Statistics for Transparency, Accountability, Results and Transformation)
Strategic intent A Better Life for All Impact on Society Economic growth & transformation Healthy life Improved service delivery People are & feel safe Decent jobs Increased use of statistical information as evidence in: Outcome: Evidence for decisions Decision- making Policy development Planning Monitoring & Evaluation Employment Finance Education Transport Statistical products In space Population Mining Agriculture Service Delivery Manufacturing Trade Construction Utilities Businesses processes Statistical production Statistical Coordination & Support Governance & Administration Statistical Frames Invest in learning and growth Technology & Infrastructure Organisation People
Invest in learning and growth Statistical literate society (Schools level: Maths4Stats – training of teachers, Census@School – Adopt a school) Statistical and technical competency (Tertiary level: KZN, Stellenbosch, Wits, UCT et) Institution building (Strategy, governance and accountability = predictable & sustainable) Statistical leadership and management (Fundamental principles of Official Statistics, Charter on Statistics in Africa and legislative reform)
Statistical production, coordination & use Frames (Business register; Geospatial Information Frame) Standards and classification (SNA 2008; SEEA 2012; NCA; ISIC4; SASQAF ) Statistical production (innovative collection methods - CPS; GDP expenditure approach; Large scale Community Survey; small area estimation) Statistical coordination (SAPS; Education; CRVS; Municipalities, certification) Communication, dissemination and use (Outreach, Technology; engage & train users)
START S Statistics are numerical facts for statecraft T Transparency is a pre-audit to ensure predictability Use A Accountability is taking responsibility and accepting consequences R Results allow parties to read the same facts T Transformation is action in unison to drive change for the better
Step change to START A T R S T Use