Download
1 / 1
10 likes | 169 Vues
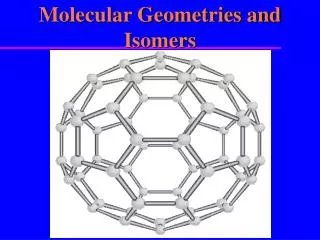
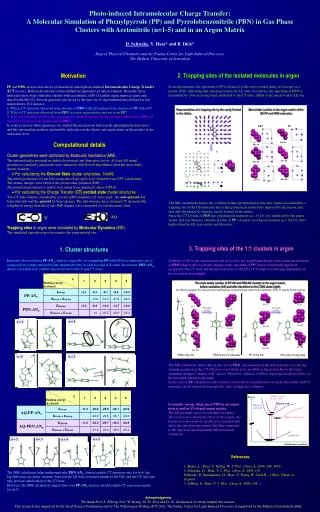
a. b. c. y. x. y. x. x. z. Representation of a trapping site by the cavity formed in the lattice. Most stable cavities in the argon matrix of the GS PP and PBN molecules. PBN. PP. Site 5a. Site 6a. Site 6a. Site 6b. Site 6b. Site 6c. Q. N. AQ. N.

E N D
a. b. c. y x y x x z Representation of a trapping site by the cavity formed in the lattice Most stable cavities in the argon matrix of the GS PP and PBN molecules PBN PP Site 5a Site 6a Site 6a Site 6b Site 6b Site 6c Q N AQ N The most stable cavities of PP:AN and PBN:AN clusters in the argon matrix, before excitation (left) and after transition to the CT-AQ state (right). The difference between the cavity geometries illustrates the structural change needed for the stabilization of the CT state by the AN molecule Transition to CT Transition to CT Site I Site I Site I Site I’ n = 4 n = 2 Site II Site II Site II’ Site II Site III Site III Site III’ Site III n =3 n = 5 PBN in the GS PBN in the CT-AQ state PP in the GS PP in the CT-AQ state PBN/AN cluster in an argon matrix Energy Matrix wall PBN in an argon matrix PBN in an AN cluster Ground state n = 5 n = 2 n = 3 n = 4 Stabilization coordinate Photo-induced Intramolecular Charge Transfer: A Molecular Simulation of Phenylpyrrole (PP) and Pyrrolobenzonitrile (PBN) in Gas Phase Clusters with Acetonitrile (n=1-5) and in an Argon Matrix D. Schweke, Y. Haas* and B. Dick* Dept of Physical Chemistry and the Farkas Center for Light Induced Processes The Hebrew University of Jerusalem 2. Trapping sites of the isolated molecules in argon Motivation In an argon matrix, the spectrum of PP is identical to the one recorded in the jet (except for a matrix shift), indicating that emission is from the LE state. In contrast, the spectrum of PBN is dominated by a broad strong band, attributed to the CT state, added to the much weaker LE one. PP and PBN are two derivatives of benzene in which photo-induced Intramolecular Charge Transfer (ICT) occurs. Both molecules have been studied in supersonic jet and in solution. Recently, these molecules have been studied in clusters with acetonitrile (AN) [1] and in argon matrices (pure and doped with AN) [2]. Several questions are raised by the new set of experimental data obtained at low temperatures. For instance: 1. Why is CT emission observed from clusters of PBN with AN and not from clusters of PP with AN? 2. Why is CT emission observed from PBN in a neat argon matrix and not from PP? 3. Why does addition of AN to the argon matrix result in a major spectral change in the case of PP and only in a very minor one in the case of PBN? In order to answer these questions, we studied the interactions between the phenylpyrrole derivative and the surrounding medium (acetonitrile molecules in the cluster and argon atoms in the matrix) at the molecular level. Computational details • Cluster geometries were optimized by Molecular mechanics (MM). • The intermolecular potential included electrostatic and dispersive forces. At least 200 initial geometries (randomly generated) were optimized with Powell algorithm to find the most stable cluster structure. • For calculating the Ground State cluster structures, 1≤n≤6: The initial geometries for the bare molecules (kept rigid) were obtained from DFT calculations The atomic charges were fitted to the electrostatic potential (ESP) The potential parameters (ε and σ) were taken from empirical values (OPLS) • For calculating the Charge Transfer (CT) excited state cluster structures: • Two CT state minima, obtained by a recent QM calculation [3], were used : the anti-quinoid AQ form (twisted) and the quinoid Q form (planar). The AQ structure has a stronger CT character but is higher in energy than the Q one.ESP charges were computed at each electronic state. The MD simulations lead to the conclusion that a perpendicular structure cannot accommodate a trapping site of the GS molecule due to the geometrical restrictions imposed by the matrix and that only the planar Q structure can be formed in the matrix. Since the CT-Q form of PBN has a high dipole moment (m = 11 D), it is stabilized by the argon matrix and can fluoresce. But the Q form of PP, of nearly zero dipole moment (m = 0.8 D),stays higher than the LE state and do not fluoresce. Trapping sites in argon were simulated by Molecular Dynamics (MD). The simulated deposition process mimics the experimental one. 3. Trapping sites of the 1:1 clusters in argon 1. Cluster structures Emission observed from PP:ANn clusters (created by co-expanding PP with AN in a supersonic jet) is composed of a single emission band attributed to the Locally Excited (LE) state. In contrast, PBN:ANn clusters in which n>4, exhibit emission from both LE and CT states. Addition of AN to the argon matrix did not lead to any significant change in the emission spectrum of PBN while it led to a drastic change in the spectrum of PP: A new broad band appeared, assigned to the CT state and the intensity ratio of the LE to CT bands was strongly dependent on the excitation wavelength. The MD simulation shows that in the case of PBN, reorientation of the AN molecule to reach the optimal geometry of the CT-AQ state is not likely to be possible in the matrix due to the large structural changes (“matrix wall” effect). Therefore, addition of AN to argon has nearly no effect on the recorded emission spectrum. In the case of PP, relaxation of the cluster is restricted to a much lesser extent by the matrix and CT emission can be observed from specific sites (of high free volume). Schematic energy diagram of PBN in an argon matrix and in AN-doped argon matrix. The LE potential curve was omitted for clarity. The violet curve shows the effect of the matrix: the barrier it creates leads to an effective potential that shifts the emission spectrum to the blue compared to the expected spectrum under full relaxation conditions. References: 1. Belau, L.; Haas, Y.; Rettig, W. J. Phys. Chem. A, 2004, 108, 3916. 2. Schweke, D.; Haas, Y. J. Phys. Chem. A, 2003, 107; Schweke, D; Baumgarten, H.; Haas, Y.; Rettig W.; Dick B., J. Phys. Chem. A. in press. 3. Zilberg, S.; Haas, Y. J. Phys. Chem. A, 2002, 104, 1. The MM calculation helps understand why PBN:ANn clusters exhibit CT emission only for n>4 :the big difference in cluster structure between the LE state (assumed similar to the GS) and the CT-AQ state may prevent stabilization of the CT state. However, the MM calculation suggest that even PP:ANn clusters should exhibit CT emission (maybe for n≥5). Acknowledgments We thank Prof. S. Zilberg, Prof. W. Rettig, Dr. W. Fuss and Dr. K. Zachariasse for many helpful discussions. This research was supported by the Israel Science Foundation and by The Volkswagen-Stiftung (I/76 283). The Farkas Center for Light Induced Processes is supported by the Minerva Gesellschaft mbH.