Download

1 / 1
10 likes | 26 Vues
What binds a client to a digital marketing agency in Hyderabad? Strategy? Returns? Creatives? Social media optimization? All of these are secondary binding agents, the major one is information or data. Information or research analysis is something that binds the clients with the agency. Information leads to improvisation and this the sole reason behind clients liking well-figured statistics.

E N D
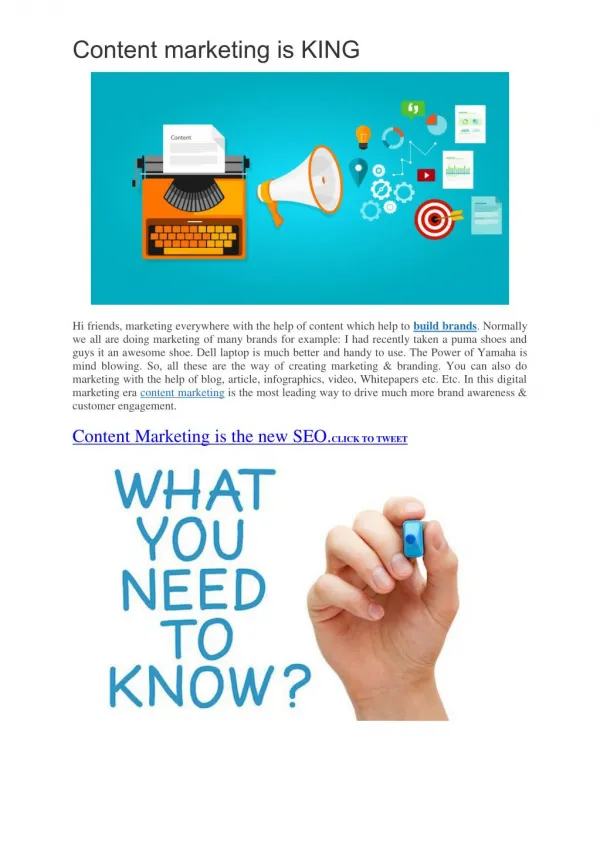
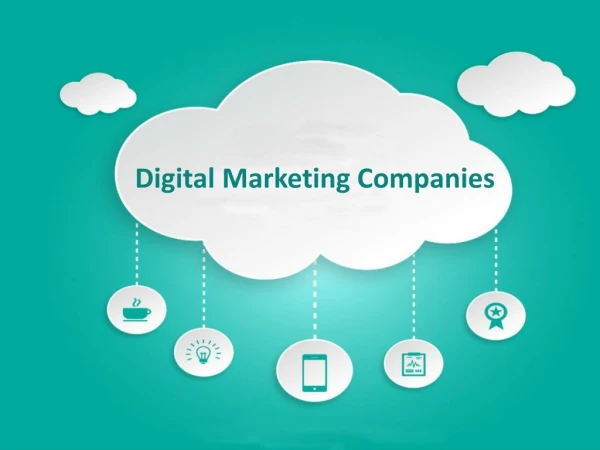
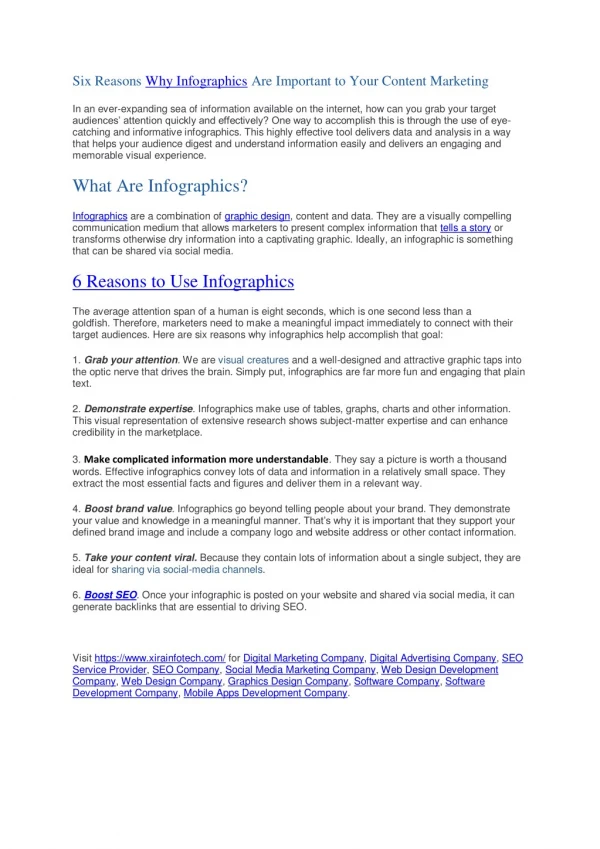
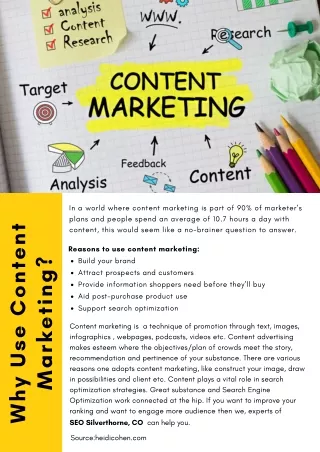
Why do digital marketing companies use infographics in their content management strategies? What binds a client to a digital marketing agency in Hyderabad? Strategy? Returns? Creatives? Social media optimization? All of these are secondary binding agents, the major one is information or data. Information or research analysis is something that binds the clients with the agency. Information leads to improvisation and this the sole reason behind clients liking well-figured statistics. Infographics are the best way to showcase any improvement or important figures about the brand. In fact, this method of showcasing data has become the most used as well as appreciated form. With the usage of colours, shapes, and numbers, brands can attract a good amount of client attention. We must understand not all clients have the same taste and hence their liking might differ from each other. So not every client likes trendy things and not every client likes classic things. Infographics are the mid solution. Every brand is ready to show their clients the figures and numbers they have achieved as they know it is the best way to convert. Let me tell you a few reasons why digital marketers use infographics. • Can catch the target audience's attention: Numbers and figures catch 90% of the human attention. Numbers are very easy to understand where a brand stands. Infographics if combined with eye-catching colours, great shapes, well-written content that is engaging and strong concrete numbers can yield a lot of results. • Increases brand awareness: With numbers being in place, people or viewers can compare a brand with another. They can easily understand and make out which position is the brand. It is a great tool to make people understand what value a brand has and hence infographics increase brand awareness as well as the brand value. • Better content understanding: Quantitative understanding is way easier than qualitative understanding. So when content is presented to the audience in the form of numbers, figures and graphs they understand it better. Additionally, infographics use elements and icons that go high if the figures are high and go down if the figures are less. This interpretation too helps in the clear understanding of the content. With infographics the major benefit is that people tend to avoid things stuffed and exhausted with content so they don't read it all, in this process they also miss out on many important facts and information, bars and graphs solve this problem and the customer is well informed.