Analysis of ERG Traces Under White Light Stimulation in Visual Research
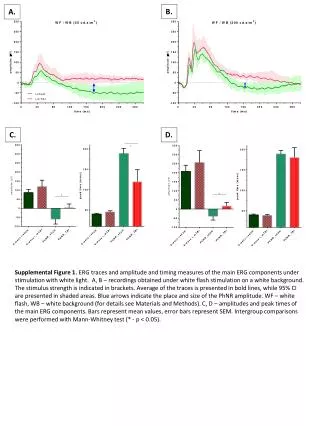
This supplemental figure presents electroretinography (ERG) traces, amplitude, and timing measures of primary ERG components in response to white light stimulation. Panels A and B show recordings under white flash stimulation on a white background, indicating stimulus strength in brackets. The average traces are depicted in bold, with 95% confidence intervals shaded. Blue arrows highlight PhNR amplitude location and size. Panels C and D illustrate the amplitudes and peak times of ERG components, with mean and SEM values indicated. Intergroup comparisons utilized the Mann-Whitney test.

Analysis of ERG Traces Under White Light Stimulation in Visual Research
E N D
Presentation Transcript
B. A. C. D. Supplemental Figure 1. ERG traces and amplitude and timing measures of the main ERG components under stimulation with white light. A, B – recordings obtained under white flash stimulation on a white background. The stimulus strength is indicated in brackets. Average of the traces is presented in bold lines, while 95% CI are presented in shaded areas. Blue arrows indicate the place and size of the PhNR amplitude. WF – white flash, WB – white background (for details see Materials and Methods). C, D – amplitudes and peak times of the main ERG components. Bars represent mean values, error bars represent SEM. Intergroup comparisons were performed with Mann-Whitney test (* - p < 0.05).