Download
1 / 1
10 likes | 135 Vues
Spatial and Temporal Carbon Cycling Variability in Central Amazon Forest. CO 2. CO 2. respiration. growth. mortality. live wood. dead wood. fragmentation. recruitment. Jeffrey Q. Chambers 1,2 , Edgard S. Tribuzy 1 , Roseana P. Silva 1 , Joaquim dos Santos 1 , and Niro Higuchi 1

E N D
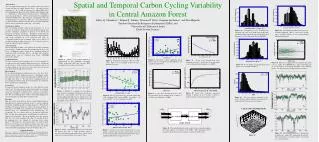
Spatial and Temporal Carbon Cycling Variability in Central Amazon Forest CO2 CO2 respiration growth mortality live wood dead wood fragmentation recruitment Jeffrey Q. Chambers1,2, Edgard S. Tribuzy1, Roseana P. Silva1, Joaquim dos Santos1, and Niro Higuchi1 1Instituto Nacional de Pesquisas da Amazônia (INPA), and 2University of California at Irvine Earth System Sciences large wood Coarse Litter Standing Stocks Introduction We are characterizing temporal and spatial variation in carbon storage and fluxes in central Amazon forest. Our study sites are primarily two 20 x 2,500 m transect plots within INPAs ZF-2 Forest Management Reserve located ~60 km north of Manaus (Fig. 1). Vegetation is old-growth closed-canopy forest. Precipitation varies seasonally (Fig. 2). 1176 tree species have been identified in nearby Ducke Reserve1. The landscape is undulating, with soils comprising Oxisols on plateaus (~70% clay, ~15% sand), Utilsols on slopes (transition textures), and Spodosols associated with small valleys (baxios) and streams (~70% clay, ~15% sand)2. Dendrometer studies We are studying monthly radial growth increment (i.e. wood production) using tree dendrometer bands distributed among four projects: community, population (3 species), wood density, and phenology (evergreen, deciduous). Preliminary results from the community level project shows large variability among individuals, and strong seasonality in wood production rates (Fig. 3). Comparing population and community studies shows that wood production variation within species (n = 3) is almost as great as variation within the entire community. Soil respiration We are measuring monthly soil respiration rates with 57 chambers placed along a ~1500 m transect that includes plateau, slope, and baxio. Preliminary results for June show a significant decline in respiration with soil moisture (Fig. 4). At many sites along the transect plots, soils are saturated from heavy 1999/2000 precipitation (Fig. 5). Stem Respiration We have measured stem respiration rates for trees stratified by growth rate from the population dendrometer project. Preliminary results shows a weak correlation between respiration and wood production (Fig. 6). In some cases, trees with very slow growth rates have relatively high stem CO2 efflux. Log(growth rate cm yr-1) Figure 12. Distribution of tree mortality rates measured since the early 1980s from the Biomass and Nutrient Experiment (Bionte) and the Biological Dynamics of Forest Fragments Project (BDFFP). Figure 13. Tree diameter increment rates were log-normally distributed. The poor fit for slow growth rates is probably indicative of errors using standard DBH measuring tapes. wood density g cm-3 Figure 1. Much of the central Amazon is characterized by this undulating topography. INPA’s north-south (NS) and east-west (EW) permanent forest inventory plots in red. Figure 7. Most leaves achieved maximum carbon fixation rate at low light levels, although there was significant height effect. Figure 8. Coarse litter decomposition rates measured from boles of dead trees were dependent on wood density (from Chambers et al. 2000). Figure 2. Monthly precipitation for Manaus (1910-1985). There is more variability in the wet season than the dry season. Figure 15. There was a slight reduction in diameter increment rates for smaller trees (BDFFP data). This relationship, and 14 pseudo-species representing maximum stem diameter classes, was important for modeling forest size structure. Figure 14. Wood density among 268 Amazon tree species7 was normally distributed. Photosynthesis We are characterizing photosynthetic traits (Amax, Adiel, Nleaf, SLA, etc.) for trees from the dendrometer projects. Preliminary results show that most leaves achieve maximum photosynthetic rates at low light levels (Fig. 7). We will explore estimating whole tree gross primary production using these measurements in conjunction with local allometric relationships3. Coarse litter Decomposition and respiration studies for coarse litter have been carried out4. Decomposition has been characterized as a function of wood density and bole diameter (Figs. 8 and 9). Coarse litter respiration was highly correlated with wood moisture content (Fig. 10). We are continuing these studies toward understanding how seasonal changes in moisture effect respiration rates. Modeling Data and results from these projects are being linked using an individual-based empirical-statistical model to explore temporal and spatial variability in carbon cycling dynamics5. Presently the model has been parameterized to explore the carbon balance of total large wood (TLW; boles, branches and coarse litter > 10 cm diameter) (Fig. 11). Distributions of tree mortality (Fig. 12), growth (Fig. 13), wood density (Fig. 14), growth rate suppression (Fig. 15), and other characteristics of individual trees were used to simulate forest dynamics. The model predicts forest age structure (Fig. 16), coarse litter standing stocks (Fig. 17), and that 10 ha is the minimum plot size required for assessing forest carbon balance6. The model also demonstrates that for a relatively short time period following a catastrophic mortality event, large wood acts as a strong carbon source, followed by many years as a weaker carbon sink, while maintaining overall carbon balance (Fig. 18). Acknowledgements This work supported by INPE/NASA’s Large-Scale Biosphere-Atmosphere Experiment in Amazonia (LBA-ecology), INPA’s Jacaranda Project funded by the Japanese International Cooperation Agency (JICA), and INPA/Smithsonian Institution’s Biological Dynamics of Forest Fragments Project. a Figure 3. ANOVAs for monthly wood production rates from the community dendrometer project (n = 309 trees). The number above the bars compare months significantly different, the number above the line is the mean (original units), and below the line the number of trees with rate > 0. Figure 10. Coarse litter respiration responded strongly to changes in wood moisture content for dead trees in forest (green) and pastures (blue). Figure 9. Coarse litter decomposition rates were also dependent on bole diameter from a sample of 155 dead trees (Chambers et. 2000). Figure 4. June soil respiration rates declined significantly with volumetric H2O content (TDR). In general, soils above 30-40% vol. were completely saturated. Figure 16. Tree age structure simulated by the model. Model results for the largest and oldest trees compared well with radiocarbon estimates8. b c Figure 11. The individual-based model (coded in Java) currently simulates the carbon balance of total large wood (TLW). The relationships used to parameter the model are based on numerous intensive field studies. Figure 5. Surface soil moisture in the wet season from the NS transect plot (Fig. 1). High moisture content is associated with plateaus and small valleys, and the lowest values are associated with the lower part of slopes. Figure 6. Average woody tissue respiration rate was only weakly correlated with average wood production rate for trees from the population dendrometer study. There was no significant differences among species (n = 3). Figure 18. Model predicted effects of background mortality (a), a single 50% catastrophic (b), and two 20% catastrophic (c) mortality events on total large wood carbon balance. Figure 17