Download
1 / 37
370 likes | 389 Vues
Explore innovative techniques like Cushion Treemaps and Botanical Visualization for efficient and clear information representation. Learn how to implement and control these methods easily for a wide range of applications.

E N D
Cushion Treemaps and Botanical Visualization Yimeng Dou 05-16-2002 ydou@ics.uci.edu
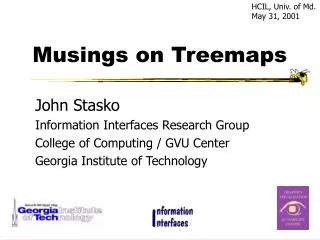
Overview • Trees and Cushion Treemaps • SequoiaView Software • Botanical Trees
Cushion Treemaps • Provide shading as a strong extra cue to emphasize hierarchical structure. • Especially good for answering global questions like “Why is my disk full?”
root Example: Trees
Treemap • Efficient use of display space • Constructed via recursive subdivision of the initial rectangle • Size of each rectangle is proportional to the size of the node • Subdivision is alternated per level: first horizontally, next vertically…
Treemap • Most useful when the feature we want to display is size • Not very good for visualizing structure of the tree (Worst case is balanced tree) • What happens if it’s a perfectly balanced tree of items all the same size?
Nested Treemap • Use slightly smaller rectangles. Siblings are enclosed by a margin. • Require viewer’s effort when tree is deeply nested. • Coloring won’t help much. It does not provide a natural hierarchical structure, and we want to use color to show other attributes.
Nested Tree-Map Non-nested Tree-Map
The Idea Behind Cushion Treemaps • Human visual system interprets variations in shade as illuminated surfaces. So shape can be constructed to encode tree structure. Add a bump to each of the two subdivisions, and repeat recursively.
The Parabolic Surfice Z is height of such a surface.
Interaction—SequoiaView • SequoiaView is an interactive system for the analysis and visualization of large tree structures. • Cushion tree can be easily constructed and If there is any change, Sequoia can easily refresh the tree. • User can define size range, color scheme, can zoom in on sub-trees, zoon out again, and select preferred color scheme and filters.
<- Sound Garden Cure Cure--Disintegration Sound Garden Studio Albums Only
Cushion Treemaps (Conclusion) • Efficient, quick generation of treemap image • Effective (shading provide a strong cue for identifying substructures) • Compact, no scrolling neccessary • Easy to implement (with the shown algorithm) • Easy to control with intuitive parameters • Wide applicability
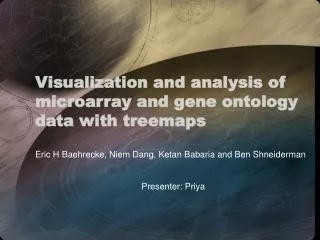
Botanical Visualization of Huge Hierarchies—Idea • People can easily see branches, leaves and their arrangement in a botanical tree. • We can use the idea of botanical modeling for Information Visualization, and map folders to branches and files to leaves. • The model used—strand model (dates back to Leonardo Da Vinci) by Holton.
Strand Model • Leaves are connected to root via a strand • Area of branch is proportional to number of leaves.
Problems • Continuing branches representing a directory can’t be easily followed at the branching point. • Those directories with many sub-directories lead to thin and long branches. • Leaves tend to clutter.
Continuation Without Extrusion • Smooth continuing branches (by adding a smooth transition between two cylinders). • It makes clear what the status of each branch is. • We can also use different color as an extra cue.
Contraction Long Branches • Conditionally remove the stem in the subbranch of the continuing branch. It replaces the binary tree with a general tree.
Files As Fruits • To prevent cluttering of leaves, we can use an icon to represent a list of files and their sizes. It can be modeled as a fruit consisting of a sphere with spots for each file.(Phi-ball) • Area of slices on the sphere is proportional to the size of the corresponding files. • When there is only one file, using cone instead of planar disks pasted on the sphere.
Phi-balls Cone’s length c equals to the square root of the ratio of the file size and the total size of the file list.
Conclusions • Cone covered phi-ball is good for visualizing a list of items, also useful for other applications • Branches and cones hardly ever collide with no special prevention • Efficient use of space by mathematical, algorithmic and physically based methods.
END Special thanks to Daniel Loewus-Deitch for providing graphs of his music library.