Die
This study explores the complex interactions between environmental factors, fuelwood collection, and outmigration probabilities among households. Utilizing GIS land use and vegetation maps, we assess the distance to essential resources like forests and the perceived environmental degradation influencing migratory decisions. The research employs a conceptual framework to calculate probabilities of outmigration based on self-reported data, environmental factors, and resource accessibility. By integrating data on rice productivity and community characteristics, we aim to generate insights into sustainable resource management and migration patterns.

Die
E N D
Presentation Transcript
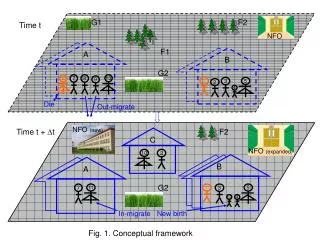
1 1 3 8 7 2 7 3 5 11 10 5 2 9 6 10 4 4 12 C G1 F2 Time t NFO F1 A B G2 Die Out-migrate NFO(new) Time t + t F2 NFO(expanded) B A G2 In-migrate New birth Fig. 1. Conceptual framework
Person i Check CVFS data Check GIS land use & vegetation maps No Special conflict or crisis? Yes Calculate: prop of Forest and grass (xe) dist to nearest forest (xf) dist to nearest NFO (xNFO) Check Time for fuelwood collection (xfd) Rice productivity (xag) Value of xo Calculate p2 = f (conflict, crisis) i = i +1 (move to next person) Generate random number RN p = p1or p2 Calculate p1 = b0+b1xe+b2xf+ b3xNFO+b4xfd+b5xag+b6xo Yes No RN < P? Outmigrate Remain Fig. 2. Determine the outmigration probability
Household i (i = 1, …, n) Start Stop Check self-reported site(s) Collect and return Yes Expand checking area Closest to Home location? No Have other potential sites? No Yes Have fuelwood? No Fig. 3. Choosing fuelwood collection site
Low-moderate Flooding + + Environmental degradation Perceived env. degradation + + + Outmigration Infertility - - - Population size % of vegetated land Fig. 4. Multiple relationships related to flooding