Unveiling Data Patterns: K-Means Clustering Algorithm and Algorithm Evaluation
90 likes | 187 Vues
Clustering data without relying on visible features like fingerprints, allowing data to speak, using K-means clustering algorithm for grouping data, steps and evaluation of the algorithm.

Unveiling Data Patterns: K-Means Clustering Algorithm and Algorithm Evaluation
E N D
Presentation Transcript
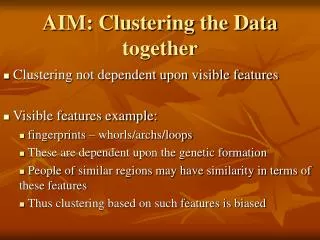
AIM: Clustering the Data together Clustering not dependent upon visible features Visible features example: fingerprints – whorls/archs/loops These are dependent upon the genetic formation People of similar regions may have similarity in terms of these features Thus clustering based on such features is biased
Letting the Data speak • Collect the data samples from the test domain • Cluster the data based on some clustering algorithm
Clustering Algorithm used • K-means clustering Algorithm • Algorithm in short: • Start with a predefined number of clusters • Initialize the clusters with a certain centroid • Run the algorithm to associate each member point to a cluster • Re-calculate the centroids
K-means clustering algorithm • Place K points into the space represented by the objects that are being clustered. These points represent initial group centroids. • Assign each object to the group that has the closest centroid. • When all objects have been assigned, recalculate the positions of the K centroids. • Repeat Steps 2 and 3 until the centroids no longer move. This produces a separation of the objects into groups from which the metric to be minimized can be calculated.
Algorithm Evaluation • Non-intuitive, yet true: • Always Converges • Reason: finite number of ways of partitioning ‘R’ into ‘k’ groups • Each time the configuration changes, we go to an improved distortion (sum of square error) • Every iteration – new configuration • If run forever, number of configurations exhaust
Algorithm Evaluation • Convergence does not guarantee Optimality • To Assure a near-Optimal solution: • Careful selection of starting points • Several runs of the Algorithm
Selecting the starting points • Using the k-nearest neighbor concept • ‘k’ corresponds to the number of clusters • Find the global mean of the entire dataset • Find the 'k' - closest data points to the global mean • These 'k'-closest data samples are the initial 'k'- centroids.
References • Statistical data mining Tutorial slides • Andrew Moore (http://www-2.cs.cmu.edu/~awm/tutorials/kmeans.html) • A Tutorial on clustering algorithms (http://www.elet.polimi.it/upload/matteucc/Clustering/tutorial_html/kmeans.html)