Download
1 / 42
440 likes | 643 Vues
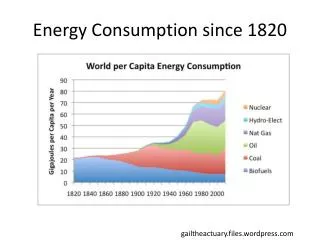
Energy Consumption since 1820. gailtheactuary.files.wordpress.com. World Energy 2010. http://science.howstuffworks.com. Wind Power Facts. One of the Oldest Forms of Energy Wind Power is Solar Power Wind Farms Pose no Threat to Birds (NSA 2007)

E N D
Energy Consumption since 1820 gailtheactuary.files.wordpress.com
http://science.howstuffworks.com Wind Power Facts • One of the Oldest Forms of Energy • Wind Power is Solar Power • Wind Farms Pose no Threat to Birds (NSA 2007) • US Wind Turbines Could Power Colorado as of 2008 • 1.9 % of U.S. Electricity Production in 2009 • 38 US States Have Wind Farms • World Wind Power 4x higher, 2000 to 2006
Turbine Types Windy II Vertical Axis Wind Turbine windturbinezone.com www.darcorp.com
www.symscape.com image.made-in-china.com Vertical Axis – More Types 2 kw A FloWind 19m Darrieus vertical-axis wind turbine
www.bls.gov Wind Turbine Parts
upload.wikimedia.org Wind Farm
Wind Farms blog.oregonlive.com staff.fcps.net On a Farm
Google map farms www.masterresource.org Aerial View
Size www.appstate.edu
theforestvoice.org Size
upload.wikimedia.org Size
135-ft blade gallery.usgs.gov Size
US Wind Map 80-meter (m) height www.windpoweringamerica.gov
mocoalliance.org US Wind Map & Transmission
NJ Wind Map US DOE Map 30 m Wind Height www.rowan.edu
Measuring Wind Speed Anemometer Tower SODAR www.erh.noaa.gov www.umass.edu www.envirotech-online.com
www.accessscience.com Wind Speed & Height • U = Ur (Z/Zr) • Where U = wind speed, m/s, at wind height Z, m; Ur & Zr are a known reference wind speed & height, = wind power law exponent • = 0.11 often used for open water • = 0.143 often used for open land
Wind Example 1: Height • An Anemometer tower is used to measure the wind speed at 15 m • The wind speed is 5 m/s • Estimate the wind speed at 30 m • Assume = 0.143
Wind Power • Pw = 0.5 A V3 • Where Pw = power of wind, W; = air density kg/m3; A = Area of wind flow, m2; V = wind velocity, m/s • W = Watts = N m / s (Newton meter per second) • Theoretical maximum efficiency of wind turbine is 0.59 • Cannot extract all power from wind or it would stop! • Commercial horizontal axis turbines: 0.3 to 0.4 efficiency • 0.1 to 0.3 if electricity generation & distribution considered • So Electrical Power from Turbine = ~0.2 Pw
Wind Example 2: Wind Power • Given: • Wind speed, V = 5 m/s • Blade radius, R = 50 m • Air density, = 1.1839 kg m-3 • What wind power passes through area swept by blades?
www.eolos.umn.edu Wind Rose
Yearly Wind Distribution Sea Girt Wind Study, Rowan University
www.wind-power-program.com Wind Turbine Power Curve
Wind Example 3: Electricity Generation Column 1 = Wind Speed Bins (0-1 m/s, 1-2 m/s, etc.) Column 2 = Hours / year wind is within a given Bin (from wind assessment) Column 3 = Power Curve of Turbine (from Manufacturer or independent study) Column 4 = Electricity Produced by turbine for each Bin
Wind Example 4: Sea Girt-Skystream 3.7 Economics • Cost of Skystream 3.7 = $13,300 • Electricity (Skystream at Sea Girt) = 2,600 kWh/yr • NJ CEP $3.20/kWh rebate = 2,600 kWh · $3.20/kWh = $8,320 • Net cost = $13,300 - $8,320 = $4980 • Revenue • Electricity = $0.12/kWh • WRECs = $0.05/kWh • Net Revenue = • Simple payback =
www.inforse.org prod-http-80-800498448.us-east-1.elb.amazonaws.com Turbine Siting - Turbulence
www.nrel.gov Wake Turbulence
ars.els-cdn.com www.planningni.gov.uk Turbine Spacing - Shadowing
Environment / Safety Issues • Habitat Disruption • Bird Mortality • Bat Mortality • Noise • Flicker • Blade Throw, Ice Throw, Tower collapse
betterplan.squarespace.com johnrsweet.com Habitat Destruction
www.earthtimes.org Birds
UK sensitive bird areas www.rspb.org.uk
www.abovetopsecret.com Birds
quixoteslaststand.com Shadow Flicker
wpcore.wpe.s3.amazonaws.com www.wind-watch.org Ice Throw
www.thumbpower.net Buffers
Buffer Zones • Ice Throw • 1.5 * (hub height + rotor diameter) • Tower Collapse • 110 % of max height (to tip of blade pointing straight up) • Rotor Fragmentation • Noise (Germany) • “quiet regions” [35 dB(A)]: 1,000-1,500 m (3,281-4,921 ft) • “middle regions” [(40 dB(A)]: 600-1,000 m (1,969-3,281 ft) • “standard region” [(45 dB(A)]: 300-600 m (984-1,969 ft) • Flicker • Typical Buffers, Vegetative Buffers • Site specific determination of incidence of flickering • Birds & Bats • 0.25 to 0.5 miles from nesting areas? • 500 m? 800 m?
www.building.co.uk Wind Farm Site Plan