Understanding Analysis of Variance (ANOVA) Techniques in Statistics
This guide provides an overview of Analysis of Variance (ANOVA) techniques, specifically one-way and two-way ANOVA, as outlined in Bluman's 7th edition. It explores how to determine significant differences among multiple means using ANOVA, and how to identify which means differ through the Scheffé and Tukey tests. Key assumptions and calculations required for performing ANOVA, including the F-test and variances, are discussed. This resource is beneficial for anyone studying statistics, particularly in the context of comparing sample means.

Understanding Analysis of Variance (ANOVA) Techniques in Statistics
E N D
Presentation Transcript
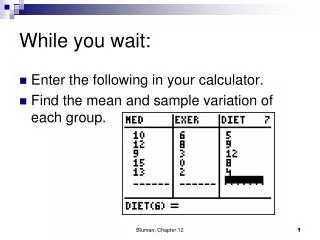
While you wait: Enter the following in your calculator. Find the mean and sample variation of each group. Bluman, Chapter 12
Chapter 12 Analysis of Variance McGraw-Hill, Bluman, 7th ed., Chapter 12
Chapter 12 Overview Introduction • 12-1 One-Way Analysis of Variance • 12-2 The Scheffé Test and the Tukey Test • 12-3 Two-Way Analysis of Variance Bluman, Chapter 12
Chapter 12 Objectives Use the one-way ANOVA technique to determine if there is a significant difference among three or more means. Determine which means differ, using the Scheffé or Tukey test if the null hypothesis is rejected in the ANOVA. Use the two-way ANOVA technique to determine if there is a significant difference in the main effects or interaction. Bluman, Chapter 12
What is the ANOVA Test? Remember the 2-Mean T-Test? For example: A salesman in car sales wants to find the difference between two types of cars in terms of mileage: Mid-Size Vehicles Sports Utility Vehicles
Car Salesman’s Sample The salesman took an independent SRS from each population of vehicles: LevelnMeanStDev Mid-size 28 27.101 mpg 2.629 mpg SUV 26 20.423 mpg 2.914 mpg If a 2-Mean tTestwere done on this data: t = 8.15 P-value = ~0
What if the salesman wanted to compare another type of car, Pickup Trucks in addition to the SUV’s and Mid-size vehicles? LevelnMeanStDev Midsize 28 27.101 mpg 2.629 mpg SUV 26 20.423 mpg 2.914 mpg Pickup 8 23.125 mpg 2.588 mpg
This is an example of when we would use the ANOVA Test. In a 2-Mean TTest, we see if the difference between the 2 sample means is significant. The ANOVA is used to compare multiple means, and see if the difference between multiple sample means is significant.
Let’s Compare the Means… Yes, we see that no two of these confidence intervals overlap, therefore the means are significantly different. This is the question that the ANOVA test answers mathematically. Do these sample means look significantly different from each other?
More Confidence Intervals What if the confidence intervals were different? Would these confidence intervals be significantly different? Significant Not Significant
ANOVA Test Hypotheses H0: µ1 = µ2 = µ3 (All of the means are equal) H1: Not all of the means are equal For Our Example: H0: µMid-size = µSUV = µPickup The mean mileages of Mid-size vehicles, Sports Utility Vehicles, and Pickup trucks are all equal. H1: At least one of the mean mileages of Mid-size vehicles, Sports Utility Vehicles, and Pickup trucksis different.
Introduction • The F test, used to compare two variances, can also be used to compare three of more means. • This technique is called analysis of variance or ANOVA. • For three groups, the F test can only show whether or not a difference exists among the three means, not where the difference lies. • Other statistical tests, Scheffé test and the Tukey test, are used to find where the difference exists. Bluman, Chapter 12
12-1 One-Way Analysis of Variance • When an F test is used to test a hypothesis concerning the means of three or more populations, the technique is called analysis of variance (commonly abbreviated as ANOVA). • Although the t test is commonly used to compare two means, it should not be used to compare three or more. Bluman, Chapter 12
Assumptions for the F Test The following assumptions apply when using the F test to compare three or more means. • The populations from which the samples were obtained must be normally or approximately normally distributed. • The samples must be independent of each other. • The variances of the populations must be equal. Bluman, Chapter 12
The F Test • In the F test, two different estimates of the population variance are made. • The first estimate is called the between-group variance, and it involves finding the variance of the means. • The second estimate, the within-group variance, is made by computing the variance using all the data and is not affected by differences in the means. Bluman, Chapter 12
The F Test • If there is no difference in the means, the between-group variance will be approximately equal to the within-group variance, and the F test value will be close to 1—do not reject null hypothesis. • However, when the means differ significantly, the between-group variance will be much larger than the within-group variance; the F test will be significantly greater than 1—reject null hypothesis. Bluman, Chapter 12
Chapter 12Analysis of Variance Section 12-1 Example 12-1 Page #630 Bluman, Chapter 12
Example 12-1: Lowering Blood Pressure A researcher wishes to try three different techniques to lower the blood pressure of individuals diagnosed with high blood pressure. The subjects are randomly assigned to three groups; the first group takes medication, the second group exercises, and the third group follows a special diet. After four weeks, the reduction in each person’s blood pressure is recorded. At α = 0.05, test the claim that there is no difference among the means. Bluman, Chapter 12
Example 12-1: Lowering Blood Pressure Step 1: State the hypotheses and identify the claim. H0: μ1 = μ2 = μ3(claim) H1: At least one mean is different from the others. Bluman, Chapter 12
Example 12-1: Lowering Blood Pressure Step 2: Find the critical value. Since k = 3, N = 15, and α = 0.05, d.f.N. = k – 1 = 3 – 1 = 2 d.f.D. = N – k = 15 – 3 = 12 The critical value is 3.89, obtained from Table H. Bluman, Chapter 12
Example 12-1: Lowering Blood Pressure • Step 3: Compute the test value. • Find the mean and variance of each sample (these were provided with the data). • Find the grand mean, the mean of all • values in the samples. • c. Find the between-group variance, . Bluman, Chapter 12
Example 12-1: Lowering Blood Pressure • Step 3: Compute the test value. (continued) • c. Find the between-group variance, . • Find the within-group variance, . Bluman, Chapter 12
Example 12-1: Lowering Blood Pressure Step 3: Compute the test value. (continued) e. Compute the F value. Step 4: Make the decision. Reject the null hypothesis, since 9.17 > 3.89. Step 5: Summarize the results. There is enough evidence to reject the claim and conclude that at least one mean is different from the others. Bluman, Chapter 12
ANOVA Please see page 634 • The between-group variance is sometimes called the mean square, MSB. • The numerator of the formula to compute MSB is called the sum of squares between groups, SSB. • The within-group variance is sometimes called the mean square, MSW. • The numerator of the formula to compute MSW is called the sum of squares within groups, SSW. Bluman, Chapter 12
Choice H In ( ) enter the lists… follow each list by a comma Bluman, Chapter 12
Scroll down to see the rest of the values. Bluman, Chapter 12
ANOVA Summary Table: see page 633 Bluman, Chapter 12
ANOVA Summary Table for Example 12-1, page 634 Compare the calculator results with the values on the chart.
ANOVA Summary Table for Example 12-1, page 634 Bluman, Chapter 12
ANOVA on your Calculator Enter the data on the lists on your calculator. Bluman, Chapter 12
Chapter 12Analysis of Variance Section 12-1 Example 12-2 Page #632 Bluman, Chapter 12
Full solution for ANOVA For ANOVA testing in addition to performing hypothesis testing, an ANOVA summary table with proper values a and symbols should be included. For examples of ANOVA summary table see page 634 and 635 of your text. Bluman, Chapter 12
ANOVA Summary Table Use the values displayed by your calculator to determine the value of each of the following. Bluman, Chapter 12
Example 12-2: Toll Road Employees A state employee wishes to see if there is a significant difference in the number of employees at the interchanges of three state toll roads. The data are shown. At α = 0.05, can it be concluded that there is a significant difference in the average number of employees at each interchange? Bluman, Chapter 12
Example 12-2: Toll Road Employees Step 1: State the hypotheses and identify the claim. H0: μ1 = μ2 = μ3 H1: At least one mean is different from the others (claim). Bluman, Chapter 12
Example 12-2: Toll Road Employees Step 2: Find the critical value. Since k = 3, N = 18, and α = 0.05, d.f.N. = 2, d.f.D. = 15 The critical value is 3.68, obtained from Table H. Bluman, Chapter 12
Example 12-2: Toll Road Employees • Step 3: Compute the test value. • Find the mean and variance of each sample (these were provided with the data). • Find the grand mean, the mean of all • values in the samples. • c. Find the between-group variance, . Bluman, Chapter 12
Example 12-2: Toll Road Employees • Step 3: Compute the test value. (continued) • c. Find the between-group variance, . • Find the within-group variance, . Bluman, Chapter 12
Example 12-2: Toll Road Employees Step 3: Compute the test value. (continued) e. Compute the F value. Step 4: Make the decision. Reject the null hypothesis, since 5.05 > 3.68. Step 5: Summarize the results. There is enough evidence to support the claim that there is a difference among the means. Bluman, Chapter 12
ANOVA Summary Table for Example 12-2 Bluman, Chapter 12
Homework • Read section 12.1 and take notes • Sec 12.1 page 637 • #1-7 and 9, 11, 13 Bluman, Chapter 12
Thanks For Watching • A special thanks to Mr. Coons for all the help and advice.