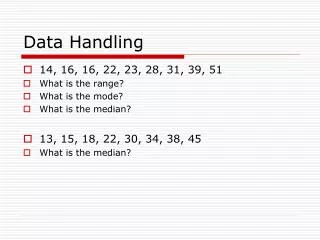
Data Handling Coursework
Data Handling Coursework. 10% of your GCSE…. Agenda. What is the coursework? The 3 assessment criteria. Marking. Dates and arrangements. Write down…. This presentation and other important information will be available to you on the web: www.yourschoolmaster.com. What is the coursework?.

Data Handling Coursework
E N D
Presentation Transcript
Data Handling Coursework 10% of your GCSE…
Agenda • What is the coursework? • The 3 assessment criteria. • Marking. • Dates and arrangements.
Write down… • This presentation and other important information will be available to you • on the web: www.yourschoolmaster.com
What is the coursework? • Mayfield high is a fictitiousschool, but the data presented is based on a real school, by means of an Excel database. • You are to develop a line of enquiry broken into several smaller areas of statistical investigation. • Marking is broken into 3 main areas, which you should cover in your investigation.
The 3 assessment criteria. • Strand 1: Specify the problem and plan. • Strand 2: Collect, process and represent data. • Strand 3: Interpret and discuss results. • Each strand is worth 8 marks for a total of 24 overall.
Strand 1: Specify the problem and plan. • MAIN AIMS: • Decide on a question. • Split into two or three hypotheses. • Model the problem mathematically. • Consider potential problems. • Decide on constraints. • Avoid redundancy – if you don’t need it don’t include it.
Strand 1: Specify the problem and plan. • Modelling a problem: • Ask the main question. Main Question: Consider the type of data available: Mayfield High Database (Secondary Data). Level 7&8 projects may contain primary data to check validity of secondary data. What is the main areas you will examine?
Strand 1: Specify the problem and plan. • Modelling a problem: • Ask the main question. Think about related topics to the main question: 2/3 hypotheses should be made. Correlation of data. Distributions of each type of data. Differences between age groups. Differences between sexes. • Related topics.
Strand 1: Specify the problem and plan. • Modelling a problem: • Ask the main question. People: Mayfield High Database gives results for Years 7, 8, 9 ,10 and 11 on the data sheet. • Related topics. • People
Strand 1: Specify the problem and plan. • Quantitative Continuous - Higher level marks, E.g. Height, weight • Are people’s height and weight related?
Strand 1: Specify the problem and plan. • For levels 7 & 8: • Problem needs creative thinking and careful specification. • Aims and plan expressed in statistical terms. • Problems with data collection are foreseen. • Steps are taken to avoid bias. • Sampling techniques avoid bias (stratified sampling). • Limitations of sampling method are given. • Techniques such as control groups and pre-sampling are used to refine the project. • Report is well structured and conclusions relate to original aims.
Strand 2: Collect, process and represent data. • MAIN AIMS: • Carry out unbiased sampling, giving reasons for sampling techniques chosen. • Graphs and calculations which are relevant, no redundancy. • Calculations must be shown, Excel is not enough.
Strand 2: Collect, process and represent data. • The Mayfield high database is available on the common drive. • Excel spreadsheet can be saved and modified. • Or on the network m drive: maths faculty folder • Choose File: “Mayfield High School Datasheet” (428KB). • Excel spreadsheet can be saved and modified.
Strand 2: Collect, process and represent data. • This will employ the use of Excel and Autograph. • Both are available on the school network. • Autograph can be downloaded on a 30day trial from: www.autograph-math.com or google ‘autograph’
GRAPHS: No graph should be used that does not help to prove or disprove one of your hypotheses. All graphs should be interpreted. You can use computer generated graphs (using Autograph), but make sure they are accurate and mathematically correct! CALCULATIONS: No calculation should be used that does not help to prove or disprove your hypotheses. All calculations should be interpreted. You can use computer generated calculations (using Excel) as long as you can describe what has been done and why it is relevant. Strand 2: Collect, process and represent data.
Autograph Comparing 2 data distributions: Scatter graphs Box and Whisker Diagrams Autograph Relating 2 sets of data: Centroid Regression Line(line of best fit) Correlation Coefficient Strand 2: Collect, process and represent data.
Strand 2: Collect, process and represent data. • For levels 7 & 8 • Problems with data are dealt with. • Results are correct and there is no redundancy. • Sampling to examine a population is justified. • Effect on accuracy of sample size is discussed. • Numerical results are appropriately rounded. • A convincing, well reasoned argument is produced. • Analysis relates to overall plan and shows interrelation of variables.
Strand 3: Interpret and discuss results. • MAIN AIMS: • Sum up all interpretation so far in concise conclusions that answer hypotheses directly. • Evaluate your results: how accurate are they? • What predictions can be made with what level of significance? • How could the techniques be refined to improve accuracy?
Strand 3: Interpret and discuss results. • Evaluation should include: • Give clear ideas for more data that could be collected (outside of Mayfield High) • Choose a further hypothesis that relates to what you have done and discuss how you would test it or model it. • If it is possible to make a prediction and check it, this will earn a high level in Strand 3.
Strand 3: Interpret and discuss results. • For levels 7 & 8: • Comment on patterns giving reasons for any exceptions. • Correctly summarise and interpret analysis. • Significance of results is appreciated. • Nature of sample is taken into consideration when making inferences. • Effectiveness of method is evaluated. • Limitations are recognised and improvements suggested. • Constructive comments on the practical consequences of work are given.
Marking. • To achieve a ‘Level 7’, you don’t need to satisfy the criteria for levels 1-6!
Dates and arrangements • You will have sufficient coursework lessons a week, some in IT rooms. • Deadline: TBA, If you are ill that day, use parents or DHL courier if necessary.
TODAY • Make sure your username and password work – if not, see Mr Ajimal/Dr Whitehouse • Access and download into your user area or home PC, the following: 1. Mayfield High Database 2. Candidate Sheet 3. This PowerPoint Presentation • Work out a method for transferring data between home & school (memory stick/ email/floppy disk)
How to succeed. • Spend time planning and modelling carefully. • Make sure your plan allows you to show off your skills. • Keep on top of the work week by week. • Keep on track, meet mini deadlines