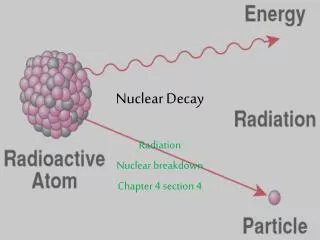
Nuclear Decay Revisited
Enter the probability of decay (.083/day) for Iodine-131 and simulate decay using IF and RAND() functions in Excel over 30 days. Sum simulated decays and create an XY Scatter graph to visualize the decay curve. Calculate the percentage of undecayed atoms after 8, 16, and 24 days based on the fit formula.

Nuclear Decay Revisited
E N D
Presentation Transcript
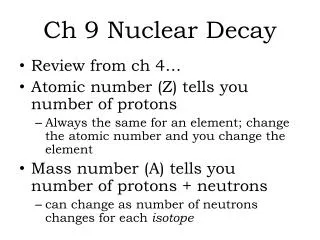
Enter the probability to decay in a time unit – approximately 0.083 for Iodine 131 to decay in one day. Also make a row of day numbers 0 to 30.
Enter 1000 1’s (shown in Col B below) and Sum them at the top of the column under the Day numbers.
Copy the formula down. (Get the “thin cross” and double click.)
Copy the sum formula over. You should see about 8.3% of the “atoms” decayed.
Copy the formula for the simulated atoms and the sum over for the 30 days.
Highlight the Day and Sum rows and make an XY Scatter graph.
Interpolation • According to your fit formula, what percentage of atoms are left (un-decayed) after 8 days? • 16 days? • 24 days?