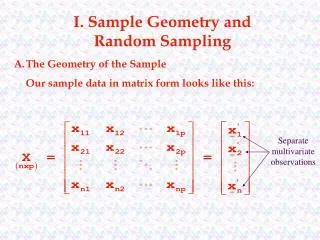
Part I. Simple random sampling
Part I. Simple random sampling. its story and the link to confidence intervals. Sample of size n = ?. Think of choosing an apartment complex to live in based on the expected utilities fee you would pay. The choices are Spruce Heights and Granada, where each has 90 equal-size units.

Part I. Simple random sampling
E N D
Presentation Transcript
Part I. Simple random sampling its story and the link to confidence intervals
Sample of size n= ? • Think of choosing an apartment complex to live in based on the expected utilities fee you would pay. The choices are Spruce Heights and Granada, where each has 90 equal-size units. • How many data points n would be reasonable for you to do an inference? • What kind of data would be necessary to deduce results applicable to you?
An Inference means • Textbook (p5) • A statistical inference is an estimate, prediction, or some other generalization about a population based on information contained in a sample. • Making a reasonable guess about the unknown based on what is known while assuming a reasonable and necessary relationship between the unknown and the known
Given SRS of n ≥ 30 • Standard error of the mean • Margin of error • Confidence interval for the mean
What does it mean to say: “with 95% confidence the interval contains the true mean”?
Part II. Simple linear regression JMP output Estimated Linear Fit SalePrice= 58249.426 + 122.99063*Total.Bsmt.SF
Notations and their meanings • (y, x) data value of a response variable • (y, x) estimated value of the response given x • x data value of an explanatory variable • y – y estimated error or a residual (of a model) • β0 β0 • β1 β1
Formulas / Notations • Total variation in the response variable • Unexplained variation in y by the model • Explained variation in y by the model • The estimate of the residual standard deviation • Probability of a (simple linear) model being dull, i.e. all slopes = 0
Confidence Intervals, again • For SLOPE • Standard error • Confidence interval • For Expected y, i.e. y • For a new data point y associated with an x (value known)