Download
1 / 1
40 likes | 210 Vues
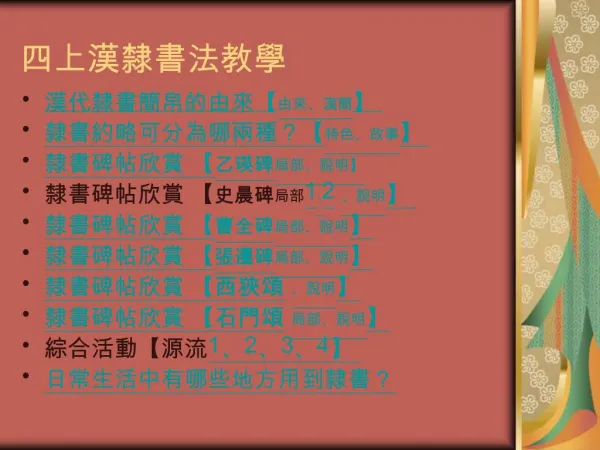
esa. A. A. B. B. F. F. E. E. D. D. C. C. Radarsat ScanSAR image of the northern of South China Sea, 2002/05/16 18:23 . Line drawing of internal waves interpreted by two SAR images. SEASAR 2006. Junmin Meng 1 Jie Zhang 1,2 (mengjm@fio.org.cn)

E N D
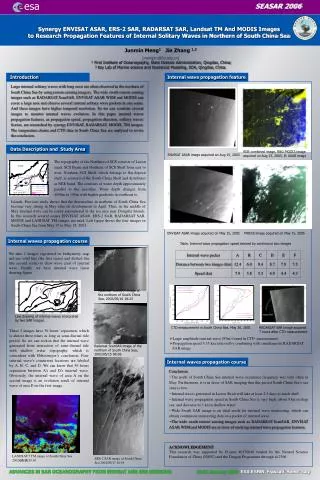
esa A A B B F F E E D D C C Radarsat ScanSAR image of the northern of South China Sea, 2002/05/16 18:23 Line drawing of internal waves interpreted by two SAR images. SEASAR 2006 Junmin Meng1 Jie Zhang 1,2 (mengjm@fio.org.cn) 1 First Institute of Oceanography, State Oceanic Administration, Qingdao, China; 2 Key Lab of Marine science and Numerical Modeling, SOA, Qingdao, China. Introduction Internal wave propagation feature Large internal solitary waves with long crest are often observed in the northern of South China Sea by using remote sensing imagery. The wide swath remote sensing images such as RADARSAT ScanSAR, ENVISAT ASAR WSM and MODIS can cover a large area and observe several internal solitary wave packets in one scene. And these images have higher temporal resolution. So we can combine several images to monitor internal waves evolution. In this paper internal waves propagation features, as propagation speed, propagation direction, solitary waves' fission, are researched by synergy ENVISAT, RADARSAT, MODIS, TM images. The temperature chains and CTD data in South China Sea are analyzed to revise the conclusion. Synergy ENVISAT ASAR, ERS-2 SAR, RADARSAT SAR, Landsat TM And MODIS Imagesto Research Propagation Features of Internal Solitary Waves in Northern of South China Sea Data Description and Study Area RGB combined image, R&G:MODIS image acquired on Aug 15, 2003, B: ASAR image ENVISAT ASAR image acquired on Aug 15, 2003 The topography of the Northern of SCS consists of Luzon strait, SCS Basin and Northern of SCS Shelf from east to west. Northern SCS Shelf, which belongs to flat deposit shelf, is seaward of the South China Shelf and distributes as NEE band. The contours of water depth approximately parallel to the coastline. Water depth changes from 4000m to 100m with higher gradients in southeast to Islands. Previous study shows that the thermocline in northern of South China Sea become very strong in May after its development in April. Thus, in the middle of May internal wave can be easily encountered in the sea area near Dongsha Islands. In this research several scenes ENVISAT ASAR, ERS-2 SAR, RADARSAT SAR, MODIS and LANDSAT TM images are used. Left figure shows the four images in South China Sea from May 15 to May 18, 2001. MODIS image acquired on May 15, 2005 ENVISAT ASAR image acquired on May 15, 2005 Internal waves propagation course Table. Internal wave propagation speed derived by continuous two images We take 2 images registered on bathymetry map and use solid line (the first scene) and dashed line (the second scene) to draw wave crest of internal wave. Finally, we have internal wave linear drawing figure. CTD measurement in South China Sea, May 30, 2001 RADARSAT SAR image acquired 7 hours after CTD measurement These 2 images have 36 hours’ separation, which is almost three times as long as semi-diurnal tide period. So we can reckon that the internal wave generated from interaction of semi-diurnal tide with shallow water topography, which is coincident with Ebbesmeyer’s conclusion. Four internal wave’s concurrent locations are labeled by A, B, C, and D. We can know that 36 hours separation between A’s and D’s internal wave. Obviously, the internal wave of area A on the second image is an evolution result of internal wave of area D on the first image. • Large amplitude internal wave (95m) found in CTD measurement • Propagation speed 3.35 kn retrieved by combining with simultaneous RADARSAT SAR image Radarsat ScanSAR image of the northern of South China Sea, 2002/05/15 06:06 Internal waves propagation course • Conclusion: • The north of South China Sea internal wave occurence frequency was very often in May. Furthermore, it is in favor of SAR imaging that this period South China Sea’s sea state is low. • Internal waves generated in Luzon Strait will take at least 2.5 days to reach shelf. • Internal wave propagation speed in South China Sea is very high, about 8 kn in deep sea, and decrease to 3 kn in shallow water. • Wide Swath SAR image is an ideal mode for internal wave monitoring, which can obtain continuous monitoring data on a packet of internal wave. • The wide swath remote sensing images such as RADARSAT ScanSAR, ENVISAT ASAR WSM and MODIS are in favor of studying internal wave propagation features. ACKNOWLEDGEMENT This research was supported by Project 40176040 funded by the Natural Science Foundation of China (NSFC) and the Dragon Programme through id 2566. LANDSAT-5 TM image of South China Sea 2002/05/18 10:10 ERS-2 SAR image of South China Sea 2002/05/17 10:39 ADVANCES IN SAR OCEANOGRAPHY FROM ENVISAT AND ERS MISSIONS 23-26 January 2006· ESA ESRIN·Frascati·Rome·Italy