Download
1 / 38
380 likes | 456 Vues
Explore HIRAD data analysis for Hurricanes Earl and Karl in September 2010, focusing on storm-centric plots and sequential legs. The datasets include lightning observation and geophysical features. Discover storm progressions with HIRAD storm center observations.

E N D
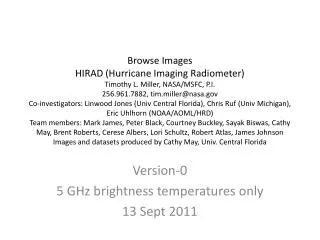
Browse ImagesHIRAD (Hurricane Imaging Radiometer)Timothy L. Miller, NASA/MSFC, P.I.256.961.7882, tim.miller@nasa.govCo-investigators: Linwood Jones (Univ Central Florida), Chris Ruf (Univ Michigan), Eric Uhlhorn (NOAA/AOML/HRD)Team members: Mark James, Peter Black, Courtney Buckley, SayakBiswas, Cathy May, Brent Roberts, Cerese Albers, Lori Schultz, Robert Atlas, James JohnsonImages and datasets produced by Cathy May, Univ. Central Florida Version-0 5 GHz brightness temperatures only 13Sept 2011
HIRAD - GRIP Browse Images v.0 • All images are excess TB in units of Kelvin at 5 GHz • Excess TBis HIRAD observed TB, minus calculated TBfor calm, no-rain ocean surface at the given off-nadir angle. It is preferred in order to eliminate the incidence angle effect, thus enabling easier identification of geophysical features in the data. • HIRAD observed 5 GHz TBis included in the provided datasets but not plotted here • Brightness temperatures for other frequencies and subsequent geophysical retrievals are still being developed at the time of this release (9 Sept 2011) • HIRAD flights for Earl (1-2 Sept) and Karl (16 Sept) are processed • Datasets are provided in Matlab and NETCDF formats and include all necessary information such as time and geographic location of each observation • Earl images are plotted out to +/- 70 degrees from nadir • Karl images are plotted out to +/- 65 degrees from nadir • Legs plotted here and provided in the datasets are for straight and level flight, as determined by constant true heading of the aircraft. • Along-track “striping” on some swaths is indicative of unresolved calibration issues. This feature is eliminated in the directory “filtered”
HIRAD / WB-57 flight track, 1-2 Sept 2010 Start 4 5 3 1 End 6 2 Circles indicate start of leg 1 and end of leg 6
Earl, 2320 UTC, in 85GHz (SSMIS F16, image courtesy NRL)Triangle indicates WB-57/HIRAD position
Earl, 0059 UTC, in 85GHz (SSMIS F18, image courtesy NRL)Triangle indicates WB-57/HIRAD position
EARL storm center information Time frame of EARL legs Observed Storm Centers September 1 – 2, 2010
EARL Leg Times • In the next 3 slides, storm centers as determined by the NOAA P-3 aircraft, given on slide 7, were used to construct a storm-centric coordinate system.
EARL legs, +/- 70 degree swaths Leg-1 Leg 5 Leg 4 Leg 6 Leg 3 Leg 2 Storm-centric Latitude and Longitude
EARL legs 1&3, +/- 70 degree swaths Leg-1 Leg 3 Storm-centric Latitude and Longitude
EARL legs 4&6, +/- 70 degree swaths Leg 4 Leg 6 Storm-centric Latitude and Longitude
Hurricane KARL September 16, 2010
HIRAD / WB-57 flight track and legs definitions End Start 1 8 5 2 10 7 6 4 9 3
Hurricane KARL, September 16, 2010 Subjectively-Determined HIRAD Storm Centers All of the following storm-centric plots use the storm centers observed by HIRAD, as shown above.
KARL legs 2-3-4-5-6, +/- 65 degree swaths Leg 2 Leg 5 Leg 6 Leg 3 Leg 4 Storm-centric Latitude and Longitude
KARL legs 10-9-8-7-6, +/- 65 degree swaths Leg 8 Leg 6 Leg 7 Leg 9 Leg 10 Storm-centric Latitude and Longitude
KARL Leg 2 +/- 65 degree swath HIRAD storm center observation Time: 19:16:49 Lat: 19.74 Lon: -93.38
KARL Leg 4 +/- 65 degree swath HIRAD storm center observation Time: 19:52:37 Lat: 19.76 Lon: -93.46
KARL Leg 6 +/- 65 degree swath HIRAD storm center observation Time: 20:33:34 Lat: 19.80 Lon: -93.59
KARL Leg 8 +/- 65 degree swath HIRAD storm center observation Time: 21:11:51 Lat: 19.82 Lon: -93.67
KARL Leg 10 +/- 65 degrees swath HIRAD storm center observation Time: 21:39:55 Lat: 19.79 Lon: -93.74
Sequential Legs • All plots are excess TB at 5GHz, at +/- 65 degrees from nadir. • Sequential plots show the progression of the storm. • The plots use HIRAD observed storm centers to determined storm-centric latitude and longitude.