
Fitting Parameters in Data Analysis: Minimizing Chi-Square for Optimal Results
This document outlines a procedure for fitting parameters in data to minimize the chi-square function. The goal is to adjust fit parameters to accurately model data points with associated errors, specifically in the context of basketball projectile motion analysis. Steps include importing data into IGOR, creating necessary waves for Y-position and Y-velocity, and performing polynomial fits. The process also involves defining error waves, using built-in functions for curve fitting, and visualizing results with graphical representation, including error bars for accurate assessment of fits.

Fitting Parameters in Data Analysis: Minimizing Chi-Square for Optimal Results
E N D
Presentation Transcript
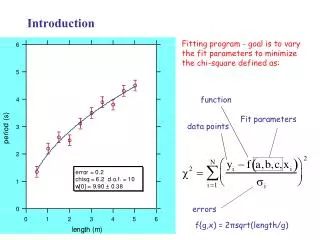
Introduction Fitting program - goal is to vary the fit parameters to minimize the chi-square defined as: function Fit parameters data points errors f{g,x) = 2πsqrt(length/g)
Basketball Movie Go to the notes for Week 3 find data Excel file Y-pos Y-vel time
Import to IGOR Make waves - called:tt, ypos and yvel Make table - Under Windows - new tableThen cut from the Excel file and pasteinto IGOR table
Fit Data to a Polynomial This dialog box - from choosing Curve Fitting under Analysis in themain menu Specify waves for the fit Built - infunctions areavailable 3 terms or quadratic
Fit in a Range of Data With a graph selected - underthe Graph menu select Show Info - then move cursors overthe data points that define therange to be fitted
Procedure Define error wave and inverse error wave. In this example: err and errinv= 1/err. In the graph of period vs length, use markers for data and show error bars. Define the user-function in the Procedure window. In this example pend Make fitting coefficients wave and set to reasonable starting values. In this example coef.


