Stefano Vignudelli & Paolo Cipollini
330 likes | 459 Vues
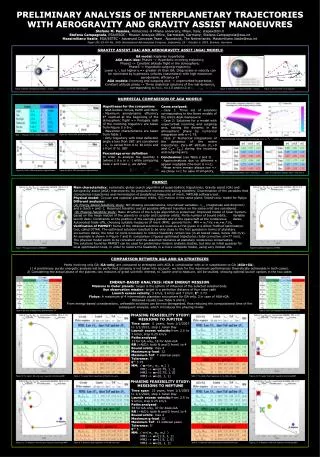
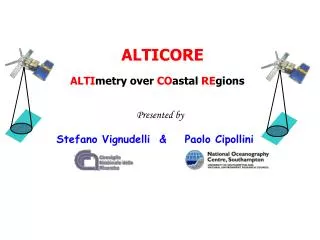
ALTICORE. ALTI metry over CO astal RE gions. Presented by. Stefano Vignudelli & Paolo Cipollini. Outline. ALTICORE context. Why do satellite altimetry in the coastal ocean?. ALTICORE in a nutshell. A partnership for European Seas. ALTICORE in action.

Stefano Vignudelli & Paolo Cipollini
E N D
Presentation Transcript
ALTICORE ALTImetry over COastal REgions Presented by Stefano Vignudelli & Paolo Cipollini
Outline ALTICORE context Why do satellite altimetry in the coastal ocean? ALTICORE in a nutshell A partnership for European Seas ALTICORE in action How to get more data (here) and better access (Fabio Venuti) ALTICORE case-study of NW Mediterranean Quantifyingthe improvement in sea level and currents estimation What in progress? Extending the concept to other seas (Caspian Sea started)
How does it work? What does it look like? A space borne tide gauge Sea level Orbit S A space borne current meter R . . . but only geostrophic component of surface currents . . . and with a temporal mean removed RADAR ALTIMETRY . . . but only amplitude A space borne wave and wind meter h SSH G Reference Ellipsoid Geoid SSH =S- R= G + h
A look back… how all it started… Rms variability of Sea Surface Height Anomaly over 1993-2004 SSALTO/DUACS multimission SSHA (DTMSLA merged “Upd” product for the Mediterranean)
A review of the work done in the Mediterranean A paper “15 years of satellite altimetry at various scales over the Mediterranean” by Cipollini P., Vignudelli S, Lyard F., Roblou L. To be published in Elsevier book titled “Remote Sensing of European Seas” Editors Vittorio Barale1 and Martin Gade2 1 Joint Research Centre of the European Commission, Ispra, Italy 2 Universitat Hamburg, Hamburg, Germany
… closer to the coasts… why? • Key impacts are in the coastal zone • e.g., we love the sea rather at beach level than at open • Decisions are usually made close where people live
The first step - ALBICOCCA ALtimeter-Based Investigations in COrsica, Capraia and Contiguous Areas • ALBICOCCA • A joint project funded by ASI (IT) and CNES (France) • WP - Exploiting satellite altimetry to resolve the complex dynamics of coastal ocean
The second step - ALTICORE ALTImetry over COastal REgions Making data of better quality • Backward reanalysis of official products • New processing strategy Making data more accessible • Avoid duplication of efforts • Data available at a mouse click Exploiting data in the coastal context • Comparison with in situ data (sea-truth) • Use for circulation, coastal dynamics, coastal modelling Building capacity in coastal altimetry • Transferring know-how • Improving cooperation between Europe and Eastern Countries The original ALTICORE-EU Project is funded by EU/INTAS and aims at providing high-resolution coastal altimetry from multiple missions over the European Seas The ALTICORE-EU consortium: • IBF/CNR Pisa, Italy (coordinator) • NOCS Southampton, UK • LEGOS/CNRS Toulouse, France • SIO and Geophys. Center Moscow, Russia • Inst. of Geophysics, Baku, Azerbaijan www.alticore.eu
Comparison at Nice Tide Gauge Nice TG Nice TG Correlation: 0.78 Residual RMS: 3.9 cm RMS explained: 37% Regional de-aliasing ALTICORE Medsea % of RMS explained: Impact of regional de-aliasing corrections Correlation: 0.75 Residual RMS: 4.1 cm RMS explained: 33% % 15 40 MOG2D Medsea (Regional configuration) improves the consistency beween the altimeter and the Nice tide gauge time series. Global de-aliasing MAP-Xtrack Global
Comparison at Nice Tide Gauge Nice TG NiceTide Gauge Correlation: 0.78 Residual RMS: 3.9 cm RMS explained: 36% Correlation: 0.81 Residual RMS: 3.7 cm RMS explained: 40% Standard editing Specific editing ALTICORE Medsea HF MAP-xtrack Medsea HF no editing % of RMS explained: Impact of the dataediting methodology The specific data editing methodology allows to decrease the noise in the altimeter time series % 15 40
Comparison at Nice Tide Gauge Nice TG Nice Tide Gauge Correlation: 0.78 Residual RMS: 3.9 cm RMS explained: 37% Correlation: 0.81 Residual RMS: 3.7 cm RMS explained: 40% HF sampling 1HZ sampling ALTICORE Medsea HF MAP-Xtrack Medsea % of RMS explained: Impact of the High Frequency sampling % 15 40 The high frequency sampling allows to go closer to the coast
Comparison at Nice Tide Gauge Nice TG Nice TG Number of dataALTICORE Medsea HFvsDT-(M)SLA Upd 115 135 115 135 ALTICORE product AVISO product ALTICORE Medsea HF DT-(M) SLA Upd The improved processing allows to recover more data far and close to the coast
Comparison at Nice Tide Gauge Correlation: 0.81 % of RMS explained: 40.4 Correlation: 0.79 % of RMS explained: 36.5 1 2 % of RMS explained: ALTICORE Medsea HFvsDT-(M) SLA Upd Nice TG Nice TG LPC Correlation: 0.74 % of RMS explained: 32.9 Correlation: 0.79 % of RMS explained: 38.4 ALTICORE product AVISO product DT-(M) SLA Upd ALTICORE Medsea HF • Better statistical results for the the ALTICORE-HF data Detection of small coastal spatial structures: are they physically realistic ? Are they linked with the LPC dynamics ?
Hovmuller plot of geostrophic velocities Far from the LPC: Dephasing between the two signals: • the Offshore and the coastal don’t « see » the same dynamics (eddy ?) . The altimetric and TG signals have equivalent amplitude: The steric effect is a large wavelenght signal 2 January LPC current Time Eddy ? Meander ? August August January Close to the LPC and to the coast: The two signals are well phased: The altimetric signal has a lower amplitude: Intrinsic seasonal variability of the LPC is shifted toward the steric signal. 1 2 1 cm/s Time latitude offshore Coast Aviso product ALTICORE product
Multi-mission altimetry scenario The following slides show what happens
rr Cu ent Genoa Liguria N Ligurian Tuscany M Capraia Corsica Channel ECC WCC Corsica Senetosa
Power spectra of multi-altimetry vs in situ Capraia Genoa Senetosa
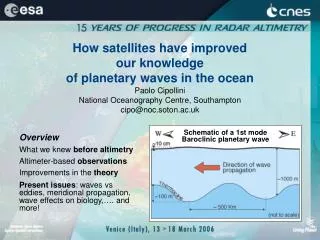
Coverage of each of the satellite altimeters. Jason (Red), Topex / Poseidon (Yellow), GFO (Black), and Envisat, ERS (White) Photo of Sumgayit sea level station
Caspian Sea level from in-situ data TOPEX/Poseidon
Some final thoughts • Altimetry over the coastal ocean demands a different processing • If data records from single altimeters are re-processed using improved algorithms and the inconsistencies between the different missions removed, the new multi-mission data set is capable of reproducing qualitative features of the coastal dynamics at higher spatial resolution and on time scales shorter than seasonal. • These proof-of-concept results have a practical edge. Modeling of coastal circulation is limited by a lack of relevant measurements to test the models. High-resolution altimetry can help redress that lack, with the goal of controlling, optimizing and better tuning the boundary conditions, as suggested in Bouffard et al. [2007]. • This is particularly significant in the prospect of forthcoming altimeter concepts which in virtue of their design are better suited for use in coastal regions, such as the wide-swath altimeter (e.g., WSOA), Ka-band altimeter (e.g., AltiKa) and the constellation of altimeters (such as GANDER)
Data management in coastal altimetry ? • Data in native format X • Online database access • Data in native format Y • CDs, mail delivery Regional Centre Data Centre • Data in standard format Z • offline ftp access Interoperability is key to success! Research Centre 26
A Data Grid for Coastal Altimetry • No computing nor storage resource sharing, only services provided through the internet • Security: only centralized authentication and activity logging • Only one typology of data • Not massive amounts of data: online data delivery is feasible
Data WS client Data WS server Application Application The Grid bricks: Web Services (WS) • Definition:a software system designed to support interoperable Machine to Machine interaction over a network [W3C] • In practice:imagine Web browser / Web server, but no humans involved 28
Web Services in Environmental Sciences • Different Protocols at different levels: • http, https • SOAP, REST, OpenDAP, etc. • OGC Web Services • Software tools: • OpenDAP provides interfaces to matlab, clients to read specific data formats (netCDF, HDF..) • OGC WCS is a standard and more tools are being developed 29
Data Grid: other issues • Data formats:how to represent data? • Native formats (RADS) • GML (now ISO 19136) • Other standard formats: netCDF • Data storage model: where to store data? • RDBMS: fast access, robust, abstraction from format issues, flexible • Flat files: software tools available for common formats, scientists are used to flat files 30
Example 1: list available data ‘select’ (MySQL) ‘list’ ‘list’
Example 2: download ‘select’ (MySQL) ‘get’ ‘get’
Example 3: download with real-time check ‘update’ (MySQL) ‘select’ (MySQL) ‘get’ ‘get’ ‘get’ ‘check_upd’ ‘check_upd’