Hearing Loss, Hearing Aids and Cochlear Implants
360 likes | 385 Vues
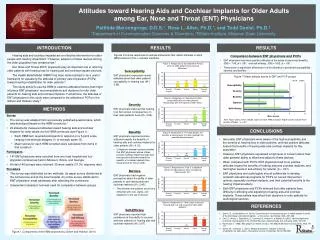
Auditory Neuroscience Prof. Jan Schnupp wschnupp@cityu.edu.hk http://auditoryneuroscience.com. Hearing Loss, Hearing Aids and Cochlear Implants. Hearing Loss. Types of Hearing Loss Quantifying Hearing Loss. Common Types of Hearing Loss. Conductive: Damage to tympanic membrane

Hearing Loss, Hearing Aids and Cochlear Implants
E N D
Presentation Transcript
Auditory Neuroscience Prof. Jan Schnupp wschnupp@cityu.edu.hk http://auditoryneuroscience.com Hearing Loss, Hearing Aids and Cochlear Implants
Hearing Loss Types of Hearing Loss Quantifying Hearing Loss
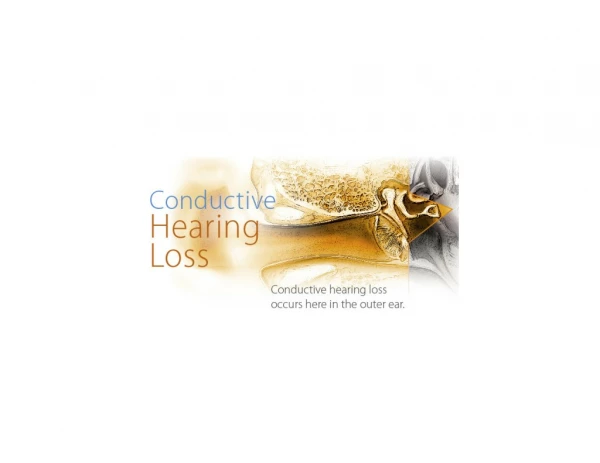
Common Types of Hearing Loss • Conductive: • Damage to tympanic membrane • Occlusion of the ear canal • Otitis Media (fluid in middle ear) • Otosclerosis (calcification of ossicles) • Sensory-Neural: • Damage to hair cells due to innate vulnerability, noise, old age, ototoxic drugs. • Damage to auditory nerve, often due to acoustic neuroma.
Pure Tone Audiometry • Put headphones on subject. Place in quiet environment. Vary intensity of pure tones at 125, 250, 500, 1000, 2000, 4000, 8000 Hz to find quietest sound level (in dB) that the subject can no longer hear. • http://auditoryneuroscience.com/pure-tone-audiogram
The Decibel Scale Large range of possible sound pressures usually expressed in “orders of magnitude”. 1,000,000 fold increase in pressure = 6 orders of magnitude = 6 Bel = 60 dB. dB amplitude:y dB = 10 log10(x/xref)0 dB implies x=xref
dB SPL (Sound Pressure Level) “Levels” (or equivalently, “Intensities”) quantify energy delivered / unit area and time. Remember that kinetic energy is proportional to particle velocity squared, and velocity is proportional to pressure. Hence:y dB SPL = 10 log10((x/xref)2) = 20 log10(x/xref)where x is sound pressure and xref is a reference pressure of 20 μPa
dB SPL and dB A • Iso-loudness contours • A-weighting filter (blue) Image source: wikipedia
dB HL (Hearing Level) Threshold level of auditory sensation measured in a subject or patient, above “expected threshold” for a young, healthy adult. -10 - 25 dB HL: normal hearing 25 - 40 dB HL: mild hearing loss 40 - 55 dB HL: moderate hearing loss 55 - 70 dB HL: moderately severe hearing loss 70 – 90 dB HL: severe hearing loss > 90 dB HL: profound hearing loss http://auditoryneuroscience.com/acoustics/clinical_audiograms
Hair Cells With and Without Noise Damage
Limitations of Early Hearing Aids Not very pretty, bulky, impractical. Range of sound frequencies that are amplified depends on resonance of device and is usually not well matched to the patient's needs. Amplification provided by ear trumpet is strictly linear, yet non-linear (“compressive”) amplification would provide better compensation for outer hair cell damage.
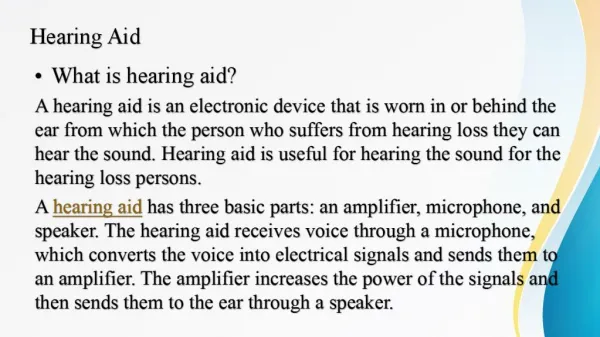
Modern Hearing Aids • Tend to be small to be easily concealed behind the ear or in the ear canal. • Have non-linear amplification. • Amplified frequency range must be matched to the particular hearing loss of the patient. • May use directional microphones and digital signal processing to do clever things such as noise suppression or frequency shifting. • Ca 12% of issued hearing aids are never worn, probably because they don't meet the patient's needs. (Source: http://www.betterhearing.org/pdfs/M8_Hearing_aid_satisfisfaction_2010.pdf)
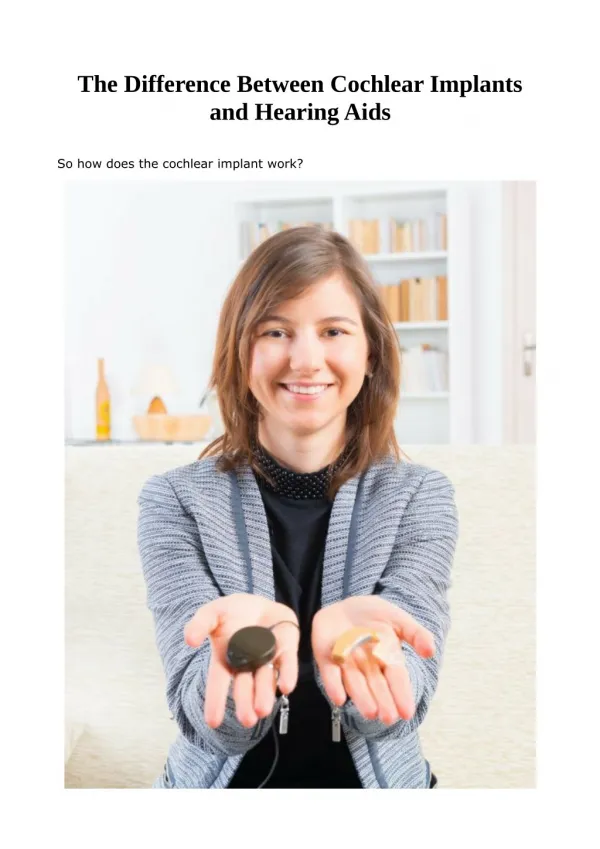
Cochlear Implants Receiver with stimulating reference electrode and Emitter Speech Processor
Limitations of Cochlear Implants • The electrode array does not reach the most apical turn of the cochlea. • Modern implants have ca 20-odd electrode channels, but because the electrodes are partly “short circuited” by the highly conductive perilympthatic fluid of the scala tympani, the number of “effective” separate frequency channels is probably no more than 8 or 9. • A variety of techniques are used to try to minimize cross-talk between channels (with only moderate success).
Monopolar (A) and bipolar (B) electrodes. A) Electric fields around a monopolar electrode drop off according to the inverse square law. B) In bipolar electrodes, opposite fields can cancel each other out, restricting the spatial extent of the electric field. Auditory Neuroscience Figure 8.3
Activation of guinea pig auditory cortex in response to CI stimulation with monopolar (MP) or bipolar (BP) electrode configuration. AN Fig 8.4 Adapted from figure 4 of Bierer and Middlebrooks (2002) J Neurophysiol 87:478-492 Bipolar stimulation helps keep the area of auditory cortex activated by CI electrodes smaller (but not by much).
Encoding Sounds for Cochlear Implants: What does the “speech processor” do?
Bandpass & envelope extraction Figure 8.5 (A) Waveform of the word “human” spoken by a native American speaker. (B) Spectrogram of the same word. (C) Green lines: Output of a set of six bandpass filters in response to the same word. The filter spacing and bandwidth in this example are two-thirds of an octave.
Noise Vocoded Speech as a Simulation of Cochlear Implants Normal Speech CI Speech Bandpass sound signal and extract envelopes for each band. Take narrowband noises centered on each band and amplitude modulate them according to the envelope. http://auditoryneuroscience.com/?q=prosthetics/noise_vocoded_speech
Spatial Hearing Through CIs Is Poor • Many CI patients have only one implant => no binaural cues. • UK children are now routinely fitted bilaterally, but the limited dynamic range of the electrodes limits ILD coding, and a lack of synchronization of implants between the ears limits ITD coding.
Pitch Perception Through CIs is Poor • Too few effective channels to provide place code for harmonic structure. • CIS stimulation strategies do not convey temporal fine structure cues to the periodicity of the sound. • This limits the ability to appreciate melodies or to use pitch as a scene segregation cue to hear out voices from background noise.
Cochlear Implants Music in your Ears? Normal Ludwig CI Ludwig http://auditoryneuroscience.com/prosthetics/music
Speakers of tonal languages may miss out on pitch cues to lexical tone with CIs. • Meng et al (2018): Mandarin tones are distinguished by pitch contour, but also by duration and loudness cues. CI users may rely much more on loudness cues, while normally hearing native Chinese speakers go almost entirely by pitch contour.
Pitch Judgements Through Cochlear Implants Figure 8.7 Perceptual multidimensional scaling (MDS) experiment by Tong and colleagues (1983). Cochlear implant users were asked to rank the dissimilarity of nine different stimuli (A–I), which differed in pulse rates and cochlear locations, as shown in the table on the left. MSD analysis results of the perceptual dissimilarity (distance) ratings, shown on the right, indicate that pulse rate and cochlear place change the implantee’s sound percept along two independent dimensions.
Further Reading • Auditory Neuroscience – Chapter 8