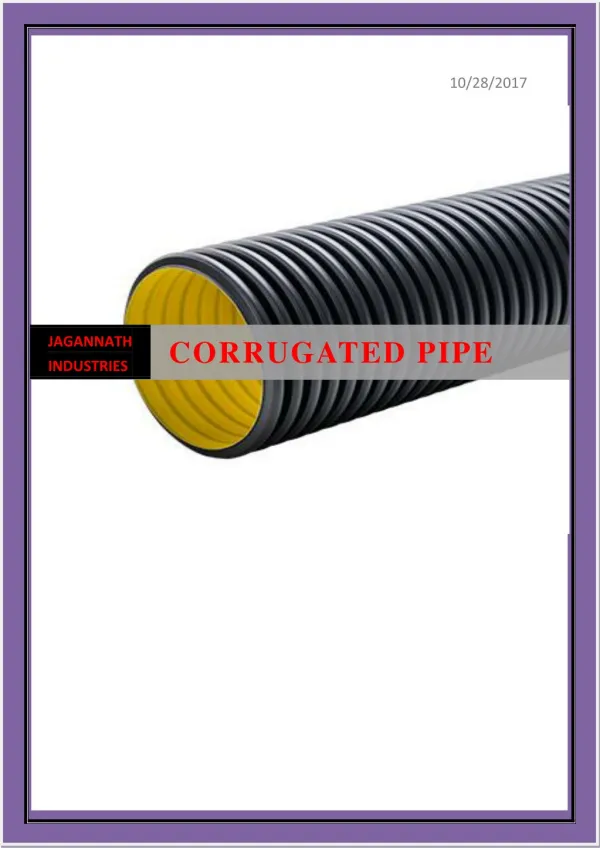
Bay Area Corrugated Pipe
130 likes | 362 Vues
Bay Area Corrugated Pipe. How is BACP doing? Why? What should they do?. BACP Performance. Profitability is Low. Return on Equity: Net Income/Equity 313,500 / 5,870,000 = 5.3% Net Profit Margin = Net Income/Sales After Tax: 313,500 / 24,000,000 = 1.3%. Components of ROE.

Bay Area Corrugated Pipe
E N D
Presentation Transcript
Bay Area Corrugated Pipe How is BACP doing? Why? What should they do? BACP Performance
Profitability is Low • Return on Equity: Net Income/Equity313,500 / 5,870,000 = 5.3% • Net Profit Margin = Net Income/SalesAfter Tax: 313,500 / 24,000,000 = 1.3%
Components of ROE • ROE = Return on Equity = Net/Equity = Net Income / Sales x Sales / Assets x Assets / Equity • Hence, some reasons can be • Margins too low? Why? • Using assets poorly? Which ones?
Analysis of Costs • Cost of Goods Sold (COGS) = 19,470,000 / 24,000,000 = 81.1% • Median for Industry is 77.8% • How important is the difference?
Analysis of Costs • Selling &Administrative Cost % of Sales (includes depreciation in the industry comps)=(2,840,000 + 675,000) /24,000,000 = 14.6% • Higher than the median (13.7%) • Lower than the maximum (19.2%) • Important?
How Well Are Assets Used? • Asset Turnover: “Rotation of Assets” • Total Asset Turnover = Sales/Assets=24,000,000 / 16,000,000 = 1.5 times • Last in the industry: They get less out of their assets than others do!
Return on Assets (Ex Post) • After-tax Return on Assets • After-tax Income/Assets = 313,500/16,000,000 = 1.96% • The very bottom is 1.9% • Very poor, again.
Fixed Assets & Current Assets • Fixed Asset Turnover = Sales / Fixed Assets = 24,000,000/3,400,000 = 7.1x • Dead last (lower than the officially listed bottom number) • Current Asset Turnover = Sales / Current Assets = 24,000,000 / 12,600,000 = 1.9x • Dead last
Current Assets: Receivables • Turnover = Sales / Accts Receivable = 24,000,000 / 4,600,000 = 5.2x • Days = 365/Turnover = 70 days • At the Median: 10x, or 2.4MM in Receivables: Could reduce by $2.2MM
Current Assets: Inventory • Turnover = Cost of Goods / Inventory = 19,470,000 / 7,200,000 = 2.7x • Days = 365/Turnover = 138 days • At the Median: 6.3x, or 3MM in Inventory: Could reduce by $4.2MM
Conclusions So Far • Overinvestment in Assets • Total Assets (all of them!) • Fixed Assets • Accounts Receivable • Inventory • That causes: Too much investment that somebody has to pay for. • A/R and Inventory Alone: >$6MM
Reduce Assets by $6MM and... • What should they do with the $6MM? • One alternative: Pay off interest-bearing debts • Thus: No interest costs • Hence: Pretax Income = Operating Income, or $1,015,000 • After tax, they’d have $669,900 and Achieve an ROE of 11.4% (669.9/5870): Mediocrity!
Summary Points • Financial ratios really can help identify the problems of an underachiever • To be meaningful, compare… • Across time • Across similar firms (comparables) • and calculate consistently • “Good” values for ratios depend on the nature of the business