Download
1 / 15
150 likes | 176 Vues
This summary outlines the extensive assets of New York City's transit system, including visible and invisible infrastructure, and discusses the importance of a comprehensive asset inventory for maintenance prioritization. It explores the transition from a legacy approach to a revised strategy for measuring good repair, analyzing the condition ratings and investment needs of key assets. The document also presents case studies and highlights the shift towards a more detailed sub-asset level evaluation. Additionally, lessons learned and insights into the maintenance and capital investment plans are discussed.

E N D
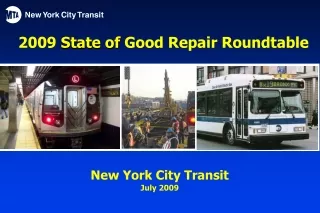
2009 State of Good Repair Roundtable New York City Transit July 2009
Summary of Major Assets Visible Infrastructure6,300 Railcars 4,700 Buses 468 Stations (340 elevators/escalators)
Summary of Major Assets Invisible Infrastructure230 Pump Rooms 216 Power Substations 720 Miles of Track 3,446 Miles of Power Cabling 194 Fan Plants 16Railcar Maintenance /Overhaul Shops 23 Rail Yards 728 Signal track miles (183 interlockings) 1,783 Mainline Switches 23 Depots/Shops 136 Subway tunnel route miles 70 Elevated Structure route miles
Taking Stock of Conditions Twenty year needs process requires full asset inventories (every 5 years) Asset inventory detail guided by projects and assessment needs Condition ratings assigned during inventory used as part of investment prioritization: -- Standard 1-4 condition rating system; condition 3-4 correlates to investment need • Project Status system tracks projects and assets
Measuring Good Repair – Legacy Approach • 1982 standard based on the promise of • addressing a universe of needs by a certain date; Difficult to explain and keep track of 25 years later; • A snapshot of SGR which didn’t • reflect missed cycles of normal • replacement or degraded • conditions or changing • standards; • Asset never falls out of SGR! • Details behind original SGR decisions lost.
Measuring Good Repair – Revised Approach More adequately communicates true conditions, functionality and capital asset needs • Recognizes SGR status on a more detailed sub-asset basis • Condition information applies regardless of previous legacy rating • Useful life, condition ratings and design standards are • applied on a sub-asset level and are weighed proportionally
Results of Revised ApproachSystem Investment Strategy Cars Mainline Track/Switch Elevators/Escalators Buses Pumps & Deep Wells Signals Structures Bus Shops & Depots Stations Tunnel Lighting Power Communications Vent Plant Subway Shops Cars Mainline Track/Switch Elevators/Escalators Buses Pumps & Deep Wells Signals Structures Bus Shops & Depots Stations Tunnel Lighting Power Communications Vent Plants Subway Shops 100% 100% 96% 100% 69% 90% 53% 95% 69% 87% 87% 81% 79% 68% 68% 66% 63% 59% 57% 39% 0% 20% 40% 60% 80% 100%
Several assets remain in “SGR”; but others are impacted: Results of Revised Approach • Power – 95% progress to 63% Category considered only • substations (and only its rectifier • equipment); now considers all • substation parts plus circuit • breaker houses, cabling, etc. Stations – 53% progress to 68% 387 stations still exhibit deficient conditions • Bus Fleet – 100% progress to 87% Strict factor of 12-year useful life rules out 600 over-age buses
Results of Revised Approach • Ventilation Plants – 69% progress to 57% Re-cast asset classification – modified to be based on tunnel segments where ventilation is used/needed; Bus Shops / Depots – 90% progress to 68% Recognizes reinvestment need required in mid-century facilities; • Signals – 68% progress to 81% Reflects greater SGR progress; more fairly represents substantial investments in interlockings versus a measurement based on track miles.
468 stations Average age: 45.5 years since last major investment Complicated multi-line and transfer operations Average station weekday ridership: 24,600 High support costs during construction Case Study: A Non-Station-ary Approach
Contributing Factors: High finish standards Historic preservation/ restoration accuracy 24/7 operations Construction market dynamics Rising code compliance Need for a New Station Approach: Rising Costs
Funding constraints delayed scheduled investments The original goal of bringing all 468 stations into good repair became increasingly unrealistic Mounting normal replacement work Capital and operating prioritization did not address critical needs in timely manner Flawed useful life assumptions Insufficient data on conditions Need for a New Station Approach: Critical Needs Not Being Addressed
Components rated on a 5 point scale Some component ratings derived from combination of subcomponents Assessment provided ability to see the “whole problem” Highlighted that earlier station rehabilitations already exhibit defects that require reinvestment Provided database to test various investment scenarios Comprehensive Condition Survey • Engineering survey of all structural, non-structural and • architectural conditions
Investments now being programmed by component ex: “Replace street stairs at 5 stations” Stations with a high proportion of deficient conditions are still programmed for full rehabilitation Eliminates defects in faster timeframe Revised Repair Strategy • Backlog defects will be eliminated within 20 years • Strategy recognizes that not • all components have the same • replacement cycle
Lessons Learned • Condition information and reports are increasingly • sophisticated – Use Them • Scheduled Maintenance/Capital renewal – these operating • and capital strategies make sense at any funding level • Make the tough life cycle choices – Throw Out the Gold • Standards • There will never be “enough money” –We can still • make the “best” decisions