Download
1 / 24
240 likes | 275 Vues
Explore the impacts of indirect taxes, subsidies, and price controls on market outcomes, prices, and government revenues. Learn how elasticity influences tax burdens and resource allocation.

E N D
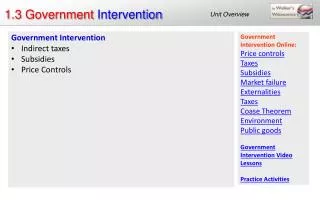
1.3a Indirect taxes • Indirect taxes are taxes that are not directly related to income. Examples include tariffs, sales taxes, and value-added taxes. Often these are ad valorem taxes or assessed as a % of the sales price. • Specific taxes are assessed as a specific flat rate tax on a good or service. For example, a $2 per airline ticket in the U.S. to pay for airport administrative costs would be considered a specific tax.
Indirect taxes are often used on goods that give negative externalities (Unit 1.4b), reducing the quantity demanded of those goods, and providing government with funds to fight the external costs. Pollution, for example, might result from the exhaust from cars and trucks, so indirect taxes are typical for gasoline.
Consequences of indirect taxes Economists usually treat indirect taxes as extra costs, pushing supply curves up and to the left, normally reducing quantities and raising prices. The PED and the PES will play a large role in determining the effects of a tax. This shift will have three effects:
1. Incidence of tax - this explains who will actually pay the tax. This could be either the producer or the consumer. The more price inelastic of demand, the more the consumer will pay. The more elastic the good or service is, the more of the tax the producer will pay.
2. Government revenues – how much income the government will generate from the tax. This will vary with the elasticity for the item being taxed. 3. Resource allocation - how the market reallocates resources after the change in price.
What is the role of elasticity in taxes? • Who pays the tax, how much money the government receives and the resource allocation are all factors, which will be impacted by the elasticities for the good or service being taxed. Let’s look at a diagram:
In the scenario above, the starting equilibrium price is $3. When an in direct tax is levied on the good in question, the supply curve will shift up to St by the amount of the tax. The new equilibrium price will rise to just below $4.
1.3b Subsidies The incidence of tax will fall relatively equally on both producers (area b) and consumers (area a) due to the relative unit elastic PED and PES. The revenues accruing to the government is the combined areas of a and b. Resources will be reallocated with quantities supplied/demanded falling from Q to Q’.
Notice the two small two triangles directly below the new equilibrium. These will combine to form a deadweight loss of efficiency. • This deadweight loss is due to the fact that consumers were willing to purchase more of the good in question yet could not due to the higher price.
This area represents a loss in society’s net benefit due to reducing production and consumption below free market levels where marginal benefit is equal to marginal cost. • Finally, remember that taxes will diminish consumer surplus and producer surplus in varying degrees depending upon the elasticities of the good or service being taxed.
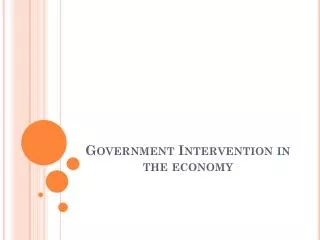
1.3b Subsidies Subsidies are payments from the government given for the production of goods or provision of services that are thought good for society. This might be because of positive externalities (such as vaccinations) or because a product (food) is thought necessary for the well - being of certain people. A subsidy can also be used to even out income streams for farmers in high income countries.
This payment can be made to either producers or consumers or the government can directly provide the product in question. Economists typically analyze the effects of subsidies as a reduction in costs, shifting supply curves down and to the right, lowering prices and increasing quantities bought and sold.
In the diagram above, the government has subsidized a given product or service. This pushes the supply curve to the right from S to Ss. The result is a lower price for consumers at Ps and higher consumption at Qs. The area between the supply curves would represent the cost to the government of providing the subsidy to either producers or consumers.
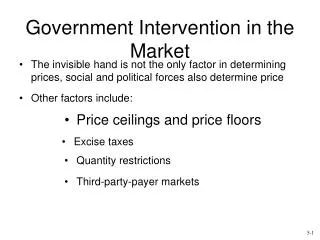
1.3c Price controls • Policy makers sometimes attempt to prevent changes in price, preventing an equilibrium price and creating an artificial shortage or surplus. • Setting a maximum price is called a price ceiling, an effort to keep prices below equilibrium.
Price ceilings create incentives for people to resell goods on a black market, allowing real prices to be higher anyway. Laws that prohibit the reselling of goods can be very difficult to enforce. Examples of price ceilings are rent control in cities like New York.
Setting a minimum price is called a price floor, an effort to keep prices above equilibrium, which will usually benefit producers.
Price controls are difficult to enforce and can be quite expensive to implement. Price floors are usually enforced through government purchase of surplus stocks at a fixed price. This can be quite expensive and has historically been a tool in supporting agricultural prices so that farmers have predictable incomes. Inefficiencies of price floors can be the added cost of how the government must dispose of the surplus output.
Buffer stock schemes For some products—goods that can be stored cheaply for a long time—a buffer stock scheme can be used to keep prices stable. These schemes combine price floors and price ceilings in attempting to manage prices.
Price stability is achieved by controlling the supplies of a good on the market: increasing supplies when prices are high, decreasing supplies when prices are low. Managers decrease supplies by putting them in storage. Buffer stock schemes are commonly seen in agricultural markets, particularly with grains or non-perishables like coffee, which can be stored for a relatively long period of time.
Many developing countries have attempted to smooth volatility in their export revenues through these schemes. In more developed countries, the strategic oil reserve might considered a variation of a buffer stock that countries use to moderate wide swings in the price of petroleum.