Download
1 / 51
520 likes | 674 Vues
Accounting for Executive. Week 5 /4/2011 (Fri) Lecture 5. Accounting ratios and the interpretation of final accounts. emo question. uiz Corner. What’s Inside ?. Learning Objectives. Profitability ratios. Return on capital employed (ROCE). Liquidity ratios.

E N D
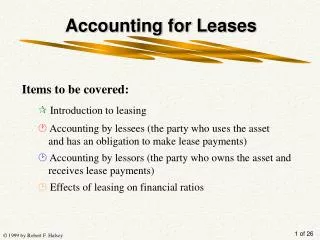
Accounting for Executive Week 5 /4/2011 (Fri) Lecture 5
Accounting ratios and the interpretation of final accounts
emo question uiz Corner What’s Inside ? Learning Objectives Profitability ratios Return on capital employed (ROCE) Liquidity ratios Management efficiency ratios Comparing the financial statements of two companies
Learning Objectives After reading this chapter, you will be able to: Classify accounting ratios into three groups. Calculate ratios for profitability. Calculate ratios for liquidity. Calculate ratios for management efficiency. Interpret final accounts based on accounting ratios. Explain the limitations of ratio analysis.
Classifying accounting ratios Accounting ratios can be classified into 3 types: Profitability ratios Liquidity ratios Management efficiency ratios Learning Objectives
Profitability ratios Gross profit ratio Net profit ratio Stock turnover rate It is also a management efficiency ratio. Expenses-sales ratio Return on capital employed Learning Objectives
Profitability ratios Gross profit ratio Gross profit 100% Sales Net profit ratio Net profit 100% Sales Stock turnover rate (in months) Cost of goods sold 12 ÷ Average stock
Profitability ratios Gross profit ratio Gross profit 100% Sales Net profit ratio Net profit 100% Sales Stock turnover rate (in weeks) Cost of goods sold 52 ÷ Average stock
Profitability ratios Gross profit ratio Gross profit 100% Sales Net profit ratio Net profit 100% Sales Stock turnover rate (in days) Cost of goods sold 365 ÷ Average stock
Profitability ratios Expenses-sales ratio Operating expenses 100% Sales It is also known as _____________________ _______. expenses as a percentage ofsales It shows how much is spent on operating expenses for every $100 of sales. uiz Corner
Profitability ratios Return on capital employed Net profit 100% Capital employed This shows the amount of net profit made for every $100 of capital employed. The higher the ratio, the more efficiently ______ is utilised and the more ________ the firm is. capital profitable Generally, capital employed refers to ____________. average capital Opening capital + Closing capital 2
Profitability ratios However, capital employed can have different meanings under different forms of business ownership. For a sole proprietorship, capital employed could mean: 1. Closing capital 2. Average capital 3. Capital balance + Long-term loans
Profitability ratios For a limited company, capital employed could mean: 1. Ordinary shareholders’ funds Issued ordinary share capital + Reserves 2. Total shareholders’ funds Issued ordinary share capital + Issued preference share capital (preferred stock) + Reserves 3. Total capital employed Issued ordinary share capital + Issued preference share capital+ Reserves+ Debentures (bonds) uiz Corner
Liquidity ratios As you have learned in Chapter 1, the liquidity ratios are: Current ratio Current assets Current liabilities Quick ratio (acid test ratio) Current assets – Closing stock Current liabilities uiz Corner Learning Objectives
Management efficiency ratios Stock turnover rate This is also a management efficiency ratio because a firm should keep stock at a ___ level while selling goods ______. This ratio indicates how well the firm is managing its sales and stock level. low quickly Credit period allowed to trade debtors Credit period received from trade creditors Learning Objectives
Management efficiency ratios Credit period allowed to trade debtors When expressed in months: Debtors 12 Sales This shows how long it takes our ____________ to pay us. trade debtors It is also known as the ____________________ or _________________. debtors collection period debtors : sales ratio The ______ the period allowed, the more _________ is the firm managed. shorter efficiently
Management efficiency ratios Credit period allowed to trade debtors When expressed in months: When expressed in weeks: Debtors 52 12 Sales This shows how long it takes our ____________ to pay us. trade debtors It is also known as the ____________________ or _________________. debtors collection period debtors : sales ratio The ______ the period allowed, the more _________ is the firm managed. shorter efficiently
Management efficiency ratios Credit period allowed to trade debtors When expressed in months: When expressed in days: Debtors 365 12 Sales This shows how long it takes our ____________ to pay us. trade debtors It is also known as the ____________________ or _________________. debtors collection period debtors : sales ratio The ______ the period allowed, the more _________ is the firm managed. shorter efficiently
Management efficiency ratios Credit period received from trade creditors When expressed in months: Creditors 12 Purchases This shows how long it takes the firm to pay its _____________. trade creditors It is also known as the ______________________ or _____________________. creditors repayment period creditors : purchases ratio If the firm takes too ____ to pay its creditors, it may lose possible ____________. However, there is no need to pay too ____. long cash discounts early
Management efficiency ratios Credit period received from trade creditors When expressed in months: When expressed in weeks: Creditors 12 52 Purchases This shows how long it takes the firm to pay its _____________. trade creditors It is also known as the ______________________ or _____________________. creditors repayment period creditors : purchases ratio If the firm takes too ____ to pay its creditors, it may lose possible ____________. However, there is no need to pay too ____. long cash discounts early
Management efficiency ratios Credit period received from trade creditors When expressed in months: When expressed in days: Creditors 12 365 Purchases This shows how long it takes the firm to pay its _____________. trade creditors It is also known as the ______________________ or _____________________. creditors repayment period creditors : purchases ratio If the firm takes too ____ to pay its creditors, it may lose possible ____________. However, there is no need to pay too ____. long cash discounts early uiz Corner
Interpretation of final accounts Final accounts are prepared in _____________. These figures are meaningless unless they are compared and related to ___________. absolute figures other figures To analyse final accounts, we always use _________ _____ rather than just looking at the absolute figures. accounting ratios Accounting ratios can show the _________ between different figures. Thus, the interpretation is _____ and more ________. relationship fairer objective
Interpretation of final accounts Importance of interpretation: 1. Items in the financial statements can be ________ one another. related to 2. Performance of the business can be compared between _____ and between ____. years firms 3. It helps identify the _________ of the management. weaknesses 4. It helps ________ assess their investments. investors 5. It helps creditors evaluate the ______________ of the firm. creditworthiness Learning Objectives
emo question Limitations of ratio analysis 1. Accounting ratios do not reflect the _________ factors of a business. qualitative 2. It is based on ___________, and not related to the future trend. past records 3. Some _______ factors may affect the accuracy of the ratios. seasonal 4. It cannot indicate the ______ behind the changes. reasons 5. It is unsuitable for comparison of two companies in _____________. different fields
emo question Trading and Profit and Loss Accounts for the year ended 31 March 20X7 Faster Company Greater Company $ $ Sales 650,000 1,050,000 Less Cost of goods sold: Opening stock 40,000 20,000 Purchases 350,000 670,000 390,000 690,000 Less Closing stock 20,000 30,000 370,000 660,000 Gross profit 280,000 390,000 Less Expenses 80,000 120,000 Net profit 200,000 270,000 The following are the final accounts of Faster Company and Greater Company:
emo question Balance Sheets as at 31 March 20X7 Faster Company Greater Company Fixed Assets $$ Net book value 700,000 950,000 Current Assets Stock 15,000 30,000 Debtors 25,000 40,000 Bank 1,000 120,000 41,000 190,000 Less Current Liabilities Creditors 55,000 70,000 (14,000) 120,000 686,000 1,070,000 Financed by: Issued share capital 200,000 200,000 Retained profits 486,000 870,000 686,000 1,070,000
emo question Required: a. Calculate the following ratios for the two companies: i. Gross profit ratio vii. Quick ratio ii. Net profit ratio viii.Credit period allowed to trade debtors (months) iii. Expenses-sales ratio iv. Return on capital employed ix. Credit period received from trade creditors (months) v. Stock turnover rate vi. Current ratio b. Compare the results of the two companies giving possible reasons for the different results.
emo question $390,000 $280,000 100% 100% $1,050,000 $650,000 Gross profit 100% Trading and Profit and Loss Accounts for the year ended 31 March 20X7 Sales Faster Company Greater Company $ $ Sales 650,000 1,050,000 Less Cost of goods sold: Opening stock 40,000 20,000 Purchases 350,000 670,000 390,000 690,000 Less Closing stock 20,000 30,000 370,000 660,000 Gross profit 280,000 390,000 Less Expenses 80,000 120,000 Net profit 200,000 270,000 i. Gross profit ratio
emo question Faster Company Greater Company Gross profit ratio Net profit ratio Expenses-sales ratio Return on capital employed Stock turnover rate Current ratio Quick ratio Credit period allowed to trade debtors Credit period received from trade creditors 43.1% 37.1%
emo question $270,000 $200,000 100% 100% $1,050,000 $650,000 Net profit 100% Sales Trading and Profit and Loss Accounts for the year ended 31 March 20X7 Faster Company Greater Company $ $ Sales 650,000 1,050,000 Less Cost of goods sold: Opening stock 40,000 20,000 Purchases 350,000 670,000 390,000 690,000 Less Closing stock 20,000 30,000 370,000 660,000 Gross profit 280,000 390,000 Less Expenses 80,000 120,000 Net profit 200,000 270,000 ii. Net profit ratio
emo question Faster Company Greater Company Gross profit ratio Net profit ratio Expenses-sales ratio Return on capital employed Stock turnover rate Current ratio Quick ratio Credit period allowed to trade debtors Credit period received from trade creditors 43.1% 37.1% 30.8% 25.7%
emo question $120,000 $80,000 100% 100% $1,050,000 $650,000 Operating expenses 100% Sales Trading and Profit and Loss Accounts for the year ended 31 March 20X7 Faster Company Greater Company $ $ Sales 650,000 1,050,000 Less Cost of goods sold: Opening stock 40,000 20,000 Purchases 350,000 670,000 390,000 690,000 Less Closing stock 20,000 30,000 370,000 660,000 Gross profit 280,000 390,000 Less Expenses 80,000 120,000 Net profit 200,000 270,000 iii. Expenses-sales ratio
emo question Faster Company Greater Company Gross profit ratio Net profit ratio Expenses-sales ratio Return on capital employed Stock turnover rate Current ratio Quick ratio Credit period allowed to trade debtors Credit period received from trade creditors 43.1% 37.1% 30.8% 25.7% 12.3% 11.4%
emo question $270,000 $200,000 100% 100% $1,070,000 $686,000 Net profit 100% Capital employed Trading and Profit and Loss Accounts for the year ended 31 March 20X7 Faster Company Greater Company $ $ ●●● Gross profit 280,000 390,000 Less Expenses 80,000 120,000 Net profit 200,000 270,000 Balance Sheets as at 31 March 20X7 Faster Company Greater Company ●●● Financed by: $$ Issued share capital 200,000 200,000 Retained profits 486,000 870,000 686,000 1,070,000 iv. Return on capital employed
emo question Faster Company Greater Company Gross profit ratio Net profit ratio Expenses-sales ratio Return on capital employed Stock turnover rate Current ratio Quick ratio Credit period allowed to trade debtors Credit period received from trade creditors 43.1% 37.1% 30.8% 25.7% 12.3% 11.4% 29.2% 25.2%
emo question Cost of goods sold Average stock Trading and Profit and Loss Accounts for the year ended 31 March 20X7 Faster Company Greater Company $ $ Sales 650,000 1,050,000 Less Cost of goods sold: Opening stock 40,000 20,000 Purchases 350,000 670,000 390,000 690,000 Less Closing stock 20,000 30,000 370,000 660,000 $370,000 $660,000 Gross profit 280,000 390,000 ($20,000 + $30,000) / 2 ($40,000 + $20,000) / 2 Less Expenses 80,000 120,000 Net profit 200,000 270,000 v. Stock turnover rate
emo question Faster Company Greater Company Gross profit ratio Net profit ratio Expenses-sales ratio Return on capital employed Stock turnover rate Current ratio Quick ratio Credit period allowed to trade debtors Credit period received from trade creditors 43.1% 37.1% 30.8% 25.7% 12.3% 11.4% 29.2% 25.2% 12.3 times 26.4 times
emo question Current assets Current liabilities vi. Current ratio
emo question Balance Sheets as at 31 March 20X7 Faster Company Greater Company Fixed Assets $$ Net book value 700,000 950,000 Current Assets Stock 15,000 30,000 Debtors 25,000 40,000 Bank 1,000 120,000 41,000 190,000 Less Current Liabilities Creditors 55,000 70,000 (14,000) 120,000 $41,000 $190,000 686,000 1,070,000 $70,000 $55,000 Financed by: Issued share capital 200,000 200,000 Retained profits 486,000 870,000 686,000 1,070,000
emo question Faster Company Greater Company Gross profit ratio Net profit ratio Expenses-sales ratio Return on capital employed Stock turnover rate Current ratio Quick ratio Credit period allowed to trade debtors Credit period received from trade creditors 43.1% 37.1% 30.8% 25.7% 12.3% 11.4% 29.2% 25.2% 12.3 times 26.4 times 0.75 : 1 2.7 : 1
emo question Current assets – Stock Current liabilities vii. Quick ratio
emo question Balance Sheets as at 31 March 20X7 Faster Company Greater Company Fixed Assets $$ Net book value 700,000 950,000 Current Assets Stock 15,000 30,000 Debtors 25,000 40,000 Bank 1,000 120,000 41,000 190,000 $190,000 – $30,000 $41,000 – $15,000 Less Current Liabilities $70,000 $55,000 Creditors 55,000 70,000 (14,000) 120,000 686,000 1,070,000 Financed by: Issued share capital 200,000 200,000 Retained profits 486,000 870,000 686,000 1,070,000
emo question Faster Company Greater Company Gross profit ratio Net profit ratio Expenses-sales ratio Return on capital employed Stock turnover rate Current ratio Quick ratio Credit period allowed to trade debtors Credit period received from trade creditors 43.1% 37.1% 30.8% 25.7% 12.3% 11.4% 29.2% 25.2% 12.3 times 26.4 times 0.75 : 1 2.7 : 1 0.47 : 1 2.29 : 1
$40,000 emo question 12 $1,050,000 Debtors 12 Sales Trading and Profit and Loss Accounts for the year ended 31 March 20X7 Faster Company Greater Company $ $ Sales 650,000 1,050,000 ●●● Balance Sheets as at 31 March 20X7 Faster Company Greater Company $$ ●●● Current Assets Stock 15,000 30,000 Debtors 25,000 40,000 $25,000 12 Bank 1,000 120,000 $650,000 41,000 190,000 viii. Credit period allowed to trade debtors
emo question Faster Company Greater Company Gross profit ratio Net profit ratio Expenses-sales ratio Return on capital employed Stock turnover rate Current ratio Quick ratio Credit period allowed to trade debtors Credit period received from trade creditors 43.1% 37.1% 30.8% 25.7% 12.3% 11.4% 29.2% 25.2% 12.3 times 26.4 times 0.75 : 1 2.7 : 1 1.47 : 1 2.29 : 1 0.46 months 0.46 months
emo question Creditors 12 Purchases Trading and Profit and Loss Accounts for the year ended 31 March 20X7 Faster Company Greater Company $ $ ●●● Less Cost of goods sold: Opening stock 40,000 20,000 Purchases 350,000 670,000 ●●● Balance Sheets as at 31 March 20X7 Faster Company Greater Company $$ ●●● $55,000 $70,000 Less Current Liabilities 12 12 Creditors 55,000 70,000 $350,000 $670,000 ●●● ix. Credit period received from trade creditors
emo question Faster Company Greater Company Gross profit ratio Net profit ratio Expenses-sales ratio Return on capital employed Stock turnover rate Current ratio Quick ratio Credit period allowed to trade debtors Credit period received from trade creditors 43.1% 37.1% 30.8% 25.7% 12.3% 11.4% 29.2% 25.2% 12.3 times 26.4 times 0.75 : 1 2.7 : 1 1.47 : 1 2.29 : 1 0.46 months 0.46 months 1.89 months 1.25 months
emo question Profitability • Faster Company was more profitable. It achieved a higher gross profit ratio, net profit ratio and return on capital employed. • Although Greater Company was less profitable, it still performed well in terms of profitability. It achieved a high gross profit ratio of 37.1%, a net profit ratio of 25.7% and a return on capital employed of 25.2%. It also had a very high stock turnover rate.
emo question Liquidity • Greater Company performed better in terms of liquidity. • Faster Company’s current ratio and quick ratio were 0.75 : 1 and 0.47 : 1, respectively. This implies that it had liquidity problems and may have difficulty repaying short-term debts.
emo question Management efficiency • Both Greater Company and Faster Company had a high stock turnover rate, which contributed to their profitability. • Both companies managed to collect payments from debtors within one month. They both took only 0.46 months to collect debts. This contributed to their liquidity. • Both companies took credit periods of similar lengths from their creditors.