Practical Use of Asset Management and Structured Decision Making
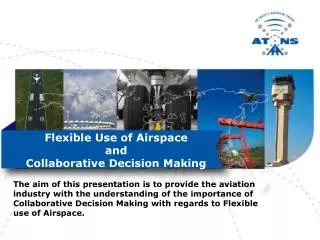
Practical Use of Asset Management and Structured Decision Making. Case Study: Seattle Public Utilities Solid Waste Facilities Master Plan Presented by: Jenny Bagby Principal Economist Seattle Public Utilities May 2, 2006. Outline of Presentation.

Practical Use of Asset Management and Structured Decision Making
E N D
Presentation Transcript
Practical Use of Asset Management and Structured Decision Making Case Study: Seattle Public Utilities Solid Waste Facilities Master Plan Presented by:Jenny Bagby Principal Economist Seattle Public UtilitiesMay 2, 2006
Outline of Presentation • Overview of Seattle’s waste management system • Description of problem of planning for new facilities • Use of three types of analysis to help choose among options • Benefit cost analysis • Value modeling • Decision analysis for modeling risk and uncertainty • Conclusion
What is Seattle Public Utilities? • City Department (our director reports to Mayor) 1200 employees including office professional folks as well as field staff • Solid Waste • Wastewater • Drinking Water • Surface Water (Drainage)
Project Background • Long-range planning (30 + years) • Involves collection, transfer, and disposal of municipal solid waste - Garbage, Yardwaste and Recyclables • Primary customers affected are the self-haul customers at the recycling and disposal stations (RDS) and adjacent neighbors
The Problem • The City’s two transfer stations are old and outdated • Transfer station reliability decreasing • Transfer system inefficiencies • Quality of customer service is decreasing • Existing facilities lack flexibility
Many Existing Problems • Safety concerns • Old wiring • Seismic retrofit needed • High Maintenance (floors, compactor) • Too many “band-aid” fixes
System OverviewFacilities • Two city-owned transfer stations • Two privately-owned transfer stations • Two intermodal rail yards • Two private processing facilities for recyclables • Private processing facility for organics composting • Private landfills
Current Waste Flow Diagram Municipal Garbage Organics Recyclables C R SH LT C R SH SH R NRDS SRDS Private Transfer IM Organics Processing Recycle Processing Landfill
System OverviewMaterials flow • City-contracted collection and transfer of residential Garbage, Yardwaste and Recyclables • City-contracted collection and transfer of commercial Garbage and organics • Private collection of commercial recyclables • Individual business and residential self-haul
Rail Landfill Connection • Two Railroad Companies Serve Seattle • Most Large Regional Landfills are Linked by Rail • Access to more than one rail line opens access to different landfills creating more competition
Waste Management Inc. - Union Pacific - Columbia Ridge Landfill
Understanding the System • Public & private facilities work in conjunction with each other • Waste flows to different facilities can change over time • A flow change to one facility affects the others
Vertical Integration of Solid Waste Business • Industry consolidation (fewer solid waste service companies than before) • Companies strive to control all aspects of the market (collection, transfer, long-haul, and disposal) • An integrated company can reduce operation costs, but may also reduce competition
Project Objectives • Improve transfer efficiency of solid waste and recyclables • Improve self-haul customer service • Minimize neighborhood impacts from transfer stations • Increase reuse and recycling opportunities • Provide long-term system flexibility
Primary Questions • What is the appropriate mix of public and private facilities? • Remodel or rebuild city stations? • Do we need additional property at the city stations? • Does a city-owned intermodal transfer station make economic sense?
Initial Assessment • A city-owned facility is needed in north and south Seattle • Siting options are limited; no substantially better sites were found for the City stations • A third City-owned intermodal transfer facility needs to be evaluated
Enter Asset Management • AKA Full Employment for Economists • C/B Analysis on all decisions (especially ones this large) • Emphasis on quantifying in $ terms everything we possibly can • Challenging! • CH2MHill to the rescue - Value Model and Decision Framework
Required Elements of an Effective Decision Framework Develop Value Modeland FormulateAlternatives CollectMeaningful,Reliable Data • Solve the right problem • Put interests & values first • Avoid advocacy & positions • Avoid useless data • Find lowest cost solution • Manage risk and liability • Track progress Develop Ensure Leadership andCommitment Implementation Plan EvaluateAlternativesand MakeDecision Frame the Problem Organizational Analytical
The OptionsKey elements • No action (required for EIS) - maintain operation and legal compliance • Modifications to RDS - retain tipping sheds • Total rebuild of RDS - including additional reuse and recycling facilities • Add property to NRDS and/or SRDS • Develop a City-owned transfer/intermodal facility
Options Assessment Steps • Develop options • Identify Quality of Service goals & criteria • Prepare conceptual layout designs for preferred options • Model Costs, Risk and Quality of Service performance for preferred options • Revise options based on results
Asset Management • We developed a cost model to quantify in dollars everything we could • Goal was to compare each of the options using benefit-cost analysis • What we couldn’t quantify we put into a value model to help display the other benefits or values of each option
System Cost Model Cost model calculates total system NET cost over 30 years of: • Transfer • Rail loading and hauling • Processing • Disposal • Collection (IF option results in changes to collection costs)
System Cost Model • Costs include: • Property Purchase/Lease • Construction Costs • Equipment Capital • Labor and Other O&M • Contractor payments such as Disposal, Private Transfer, Processing • Long term competitive benefits of partnering • Revenues from partner tons
Cost Results Option 4: Cost by Function $80,000,000 $70,000,000 $60,000,000 $50,000,000 $40,000,000 $30,000,000 $20,000,000 $10,000,000 $- 2004 2006 2010 2014 2018 2020 2022 2026 2030 2036 2008 2012 2016 2024 2028 2032 2034
Quality of ServiceAssessment Primary Services Provided • Waste reduction & recycling • Customer service • Work environment • Built environment (community) impacts • Natural environment impacts
Natural and Built Environment Impacts are broken out by facility (NRDS, SRDS, Intermodal). Shaded criteria/ sub-criteria receive performance scales, weights, and option scores.
Importance of Value Model • Facilitated process • Way to get all issues and concerns identified • Moved discussion from a high level where things are hard to evaluate • Began discussing what everyone really meant/valued when they held a certain position
Performance Value Criterion Measure Rate x Weight = Score A 3 20 60 B 4 45 180 C 1 10 10 D 2 25 50 Total Score 300 Quantified Evaluation Approach: Multi-Attribute Utility Theory
Quality of ServiceAssessment • Non-monetizable Quality of Service benefits were quantified in a variety of ways such as • Length of time queuing • Square feet of space available for operations • 1-5 scale - best professional judgement • etc.
SPU Solid Waste Facility Masterplan Contributions by Criteria - Total Quality of Service Score Note: Option 5 and 11 score highest on waste reduction. This is the differentiating for its leading score. Used Criterium Decision Plus Software
Overall Results Quality of Service vs. Cost 1 Insert Cost Risk Profile Graph and Tornado diagram 0.8 Option 5 Option 7 Option 4B Option Score Option 2A Option 3 0.6 Option 6 Option 4A Option 2B 0.4 Option 1 Option 0 0.2 0 480 516 552 588 624 660 Cost ($M)