DADDS DCS LRIT Prototype LRIT Latency Results
360 likes | 574 Vues
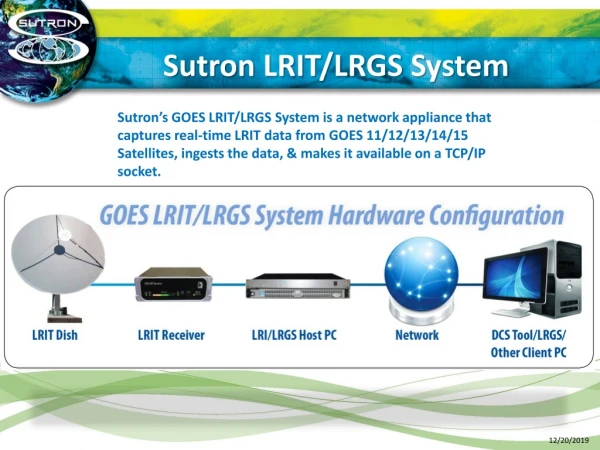
DADDS DCS LRIT Prototype LRIT Latency Results. Presented by Microcom Design, Inc. May 2014. Task Description. Authorized under a DCS Sustaining Engineering Contract. Develop a DADDS Process to create and disseminate LRIT DCS Message files. Transfer files to LRIT system via SFTP.

DADDS DCS LRIT Prototype LRIT Latency Results
E N D
Presentation Transcript
DADDS DCS LRIT PrototypeLRIT Latency Results Presented by Microcom Design, Inc. May 2014
Task Description • Authorized under a DCS Sustaining Engineering Contract. • Develop a DADDS Process to create and disseminate LRIT DCS Message files. • Transfer files to LRIT system via SFTP. • Develop text based and graphical tools to analyze latency. • Utilize Microcom LRIT Receiver to monitor data flow and determine end-to-end latency. • DAMS-NT to DADDS to LRIT to Reception • Include configurable settings to determine file generation: • Message Count • Byte Count • Time – timeout to minimize latency Microcom Design, Inc.
DOMAST versus LRIT Comparison • DOMSAT streams DCS messages, while LRIT transfers files. • For efficiency, multiple DCS messages must be collected into files. • DOMSAT stream “dedicated” to DCS, LRIT stream shares multiple NOAA products; DCS, EMWIN, Imagery. • DOMSAT uses Domestic Satellite, LRIT broadcast over GOES. • DOMSAT requires annual funding, LRIT has no user recurring satellite usage costs. • DOMSAT has limited coverage outside of CONUS, LRIT has hemispherical coverage. • DOSAT primarily used for other data, GOES/LRIT dedicated to environmental usage. • DOMSAT frequency in Ku band, while LRIT in L band. • DOMSAT highly susceptible to weather fading, LRIT far more robust. Microcom Design, Inc.
LRIT Operational Summary 1 • Downlink Frequency: 1691 MHz (L Band) • Information Data Rate: 128 kbps (16 kBps) • Forward Error Correction: Convolution and Block • Inner Code: Rate ½ Viterbi, Constraint Length 7 • Outer Code: Reed Solomon (255,223) – 223 information bytes and 32 check bytes; can correct up to 16 bytes in error • Data Files are Packetized and Framed • Frame: 1024 Bytes • 4-byte FSS, followed by four interleaved 255 byte RS blocks. • ~ 880 bytes of information in each frame. • Packets: Variable up to 8 kilobytes • Each Packet terminated in CRC-16. • Large Files require multiple packets. • First Packet contains LRIT Headers. Microcom Design, Inc.
LRIT Operational Summary 2 • Files can be sent on one of 63 Virtual Channels (VC) • Each Frame begins with a 6-byte sequence that defines the VC and includes a 3-byte Frame Counter. • Frame Sequence Counters are unique to VC. • Virtual Channels Represent a Priority • The lower the VC number, the higher the priority. • Priority scheme allows smaller, high priority files to be interspersed with larger, low priority files. • EMWIN uses VC 00; highest priority. • LRIT is a Continuous Transmission • A 64TH Virtual Channel (VC 63) is used for “Fill”, i.e. when there is no data to send. • Actual transmission rate is 292.7 ksps (kbps) 128 = (292.7 / 2) * (223/255) Microcom Design, Inc.
LRIT DCS Initial Analysis – Frame Utilization 1 Microcom Design, Inc.
LRIT Initial Analysis – Frame Utilization 2 • Initial analysis showed that the LRIT stream was dominated by long periods of either DCS, Imagery, or Fill, but … • EMWIN maintained steady flow of data. Microcom Design, Inc.
LRIT Initial Analysis – Product Utilization • Initial Frame Analysis Showed: • EMWIN: ~ 7.3 kbps ~5.7% • DCS: ~15.3 kbps ~12.0% • Imagery: ~41.2 kbps ~32.2% • Fill: ~64.2 kbps ~50.1% • Initially: • EMWIN used VC00 • DCS used VC18 (High), VC38 (Medium), VC53 (Low) • Imagery used VCs 13, 23, 33, 41, and 43 • More Recently: • EMWIN continues to use VC00 • DCS was using 1, 48, and 53 • Imagery shared VC53 with Low Priority DCS Files Microcom Design, Inc.
LRIT DCS File Summary • High Priority Files: • Contain one of two platforms (or both) that transmit on six minute intervals at the top of the minute. • Being used by NOS and NWS to facilitate their latency testing. • Files sent in 1 Packet/Frame. • Medium Priority Files: • Consist of approximately 500 platforms. • All platforms appear to transmit on DCS channels 40-49. • Files typically require 1 Packet sent over several Frames. • Low Priority Files: • Everything not in Low or Medium priority files. • Files are quite large (~200 kilobytes, ~1000 messages). • Files typically sent about every 2 minutes. Microcom Design, Inc.
LRIT Baseline Latency • Typical composite latency ~100 seconds with regular peaks over 300 seconds; some as high as 600 seconds. • Peaks believed to be primarily due to DCS Low Priority files sharing same VC as imagery files. Microcom Design, Inc.
Prototype Target Goals • Create compatible DCS LRIT files from DADDS. • Determine if the LRIT system can handle smaller more frequent files. • Send all DCS messages as High priority. • Accurately measure overall LRIT DCS latency. • Breakdown latency into constituent components. • See if DADDS can provide improvement over existing dissemination path. Microcom Design, Inc.
Initial Live Test Run • Test was run on April 16, 2014 from approximately 14:24:30 to 14:29:30 UTC. • All data sent as High Priority. • DCS data collected and sourced from NSOF DADDS. • Messages collected into files of approximately 8 kilobytes each. • Total of 58 files generated and transmitted. • Approximately 2450 DCS messages were transmitted and received. • Test run was performed while WCDA DCS LRIT was also flowing. • No anomalies were detected and test ran as expected. • After confirming data was flowing and no issues were detected, performance data was collected from approximately 14:27:00 to 14:29:30 UTC. Microcom Design, Inc.
1ST Test – Frame Utilization Graph Microcom Design, Inc.
1ST Test – Frame Utilization Notes • LRIT Frames counted for DADDS DCS, EMWIN, Fill, and Other. • Other includes both Imagery and the DCS Data coming from WCDA. • A data sample set occurs every 100 LRIT Frames. • NSOF DADDS DCS Data accounted for approximately 10% of the Total Frames. • Average: 9.8 Frames per 100 • Minimum: 0 • Maximum: 28 • EMWIN accounted for approximately 6% of the Total Frames. • Insertion of a second DCS stream did not create any major issues. • Only impact was a slight reduction in the transmission rate of the “Other” frames. • This short duration test showed minimal Fill packets (~7%). • Longer term testing has shown that the LRIT typically only runs at 65-70% utilization (30-35% Fill). Microcom Design, Inc.
1ST Test – Overall Results • Data points generated and accumulated every 100 messages. • Computer generating graph had clock running 5-6 seconds fast. Microcom Design, Inc.
1ST Test – Overall Notes • Latency calculated from the time the message was received to time it was ingested by test computer at Microcom. • Average DCS message latency for this test run calculated on every 100 messages. • Note: After the test run was complete, the test computer’s clock was checked and was found to be 5-6 seconds fast. • Accounting for computer’s clock error, average latency for the initial test run was actually on the order of 45-50 seconds. Microcom Design, Inc.
1ST Test – LRIT File Latency Histogram Microcom Design, Inc.
1ST Test – LRIT Latency Notes • Latency calculated in seconds from file generation time to reception by LRIT Receiver. • Average: 25 seconds • Minimum: 19 seconds • Maximum: 35 seconds • This latency encompasses the transfer time from DADDS-to-LRIT, the LRIT processing time, and the transfer time from the LRIT processor to the LRIT uplink transmitter. • Note: The times are approximately 3-5 seconds higher than actual. • Microcom utilized the first DCS message in the file to generate the filename timestamp. • A better indication would be provided by using the time the last message was added to the file. • Average file latency is predicted to be more on the order of 20 seconds or so. • Average Latency remained relatively consistent over initial run. Microcom Design, Inc.
1ST Test – DADDS LRIT File Generation Microcom Design, Inc.
1ST Test – DADDS LRIT Latency Notes • Latency calculated in seconds from end time of first message in file to file timestamp: • Average: 16.4 seconds • Minimum: 13.5 seconds • Maximum: 18.6 seconds • DADDS file latency on the order of 16 seconds. • Higher than expected, but optimizing DADDS process was not a primary goal of this task. • Microcom believes DADDS latency can be easily reduced to 5-10 seconds. • Latency was consistent over initial run. Microcom Design, Inc.
Second Live Test Run • Test was run on April 23, 2014 from approximately 13:27:30 to 16:05:00 UTC. • All data sent as High Priority. • DCS data collected and sourced from NSOF DADDS. • Messages collected into files of approximately 8 kilobytes each. • A total of 2,035 files were generated, transmitted, and received. • Over 76,000 DCS messages were transmitted and received (~29,000 messages per hour). • Test run was performed without WCDA DCS LRIT data flowing. • No operational issues were detected; independent confirmation of reception from NOS and NWS. • Performance data was collected from almost the entire run UTC. Microcom Design, Inc.
2ND Test – Frame Utilization Graph Microcom Design, Inc.
2ND Test – Frame Utilization Notes • LRIT Frames counted for DCS, EMWIN, Fill, and Other; Other primarily includes Imagery. • A data sample set occurs every 100 LRIT Frames. • DCS Data accounted for 10.24% of the Total Frames. • Average: 10.24 Frames per 100 • Minimum: 0 • Maximum: 45 • Stnd Dev: 7.6 • EMWIN accounted for 5.73% of the Total Frames. • Other (Imagery) accounted for 57.14% of the Total Frames. • Fill accounted for 26.89% of the Total Frames. • EMWIN and DCS packets flowed at relatively consistent rate, while Imagery & Fill dominated alternately. Microcom Design, Inc.
2ND Test – Frame Utilization Hour 14 Microcom Design, Inc.
2ND Test – Overall Results • Data points generated and accumulated every 100 messages. Microcom Design, Inc.
2ND Test – Overall Notes • Latency calculated from the time the message was received to time it was ingested by test computer at Microcom. • Average end-to-end latency for the bulk of this run was on the order of 40 seconds. • From ~15:05 to ~15:25 the average latency gradually increased to a peak of over 65 seconds and then came back down to ~40 seconds. • Standard Deviation of Latency consistently remained under 5 seconds. Microcom Design, Inc.
2ND Test – Existing Dissemination Comparison • Typical composite latency 60-80 seconds with peaks over 200 seconds. • Improvement from initial baseline due to move to using VC 01 for all DCS files. Microcom Design, Inc.
2ND Test – LRIT File Latency Histogram Microcom Design, Inc.
2ND Test – LRIT Latency Notes • Latency calculated in seconds from file generation time to reception by LRIT Receiver. • Average: 22.9 seconds • Minimum: 13 seconds • Maximum: 42 seconds • Stnd Dev: 4.2 seconds • Latency encompassed the transfer time from DADDS-to-LRIT, the LRIT processing time, and the transfer time from the LRIT processor to the LRIT uplink transmitter. • Note: The times are approximate 3-5 seconds higher than actual. • Microcom utilized the first DCS message in the file to generate the filename timestamp. • A better indication would be provided by using the time the last message was added to the file. • Average file latency is predicted to be more on the order of 20 seconds or so. • Average Latency remained relatively consistent over entire run. Microcom Design, Inc.
2ND Test – LRIT File Latency Over Run Microcom Design, Inc.
2ND Test – DADDS File Latency Microcom Design, Inc.
2ND Test – DADDS File Latency Notes • Latency calculated from end timestamp of first DCS message in file to the file generation time. • Average: 18.9 seconds • Minimum: 13 seconds • Maximum: 42 seconds • Stnd Dev: 6.4 seconds • Baseline average appears to be on the order of 16-17 seconds. • Discounting three spiked up sections, latency remained relatively consistent over entire run. • Excessive rise in processing delay accounts for increased overall latency shown in graph, i.e the point centered about 15:15 UTC where the overall latency increased to over 65 seconds. • Smaller spike at 14:10 in above graph also correlates to similar spike in overall graph. • At this time Microcom has no specific explanation for the increases in DADDS processing time. • Most likely cause is server performance due to some other function that required high CPU resources. • Additional investigation will be required to determine exact cause. • Should be readily addressable. Microcom Design, Inc.
Target Goals Acheived • Testing was highly successful and achieved target goals: • DADDS can flow DCS data to LRIT system. • DADDS DCS data files were properly formatted: • Message data was correctly received by Microcom’s LRIT Receiver, which also receives WCDA sourced DCS data. • Independent confirmation provided by NOS (Mark Bushnell, Warren Krug) and NWS (Brian Jackson) during and post test run. • LRIT system has no issues in processing smaller more frequent files. • LRIT throughput not significantly affected by sending all DCS messages as High Priority. Microcom Design, Inc.
Testing Conclusions • Testing provided solid baseline information on overall latency and distribution of latency in various systems. • Overall typical latency is on the order of 35-45 seconds. • Latency remains consistent over extended periods of time. • LRIT processing and distribution latency on the order of 20-25 seconds. • Typical DADDS file generation latency is on the order of 15-18 seconds. • The DADDS-to-LRIT prototype and subsequent analysis by Microcom has clearly demonstrated capability to accurately measure and to pinpoint problem areas in the overall latency. Microcom Design, Inc.
Possible Next Steps • The unusual and unexpected areas where latency above baseline will require additional investigation to determine the cause. However, Microcom is confident this can be mitigated. • Microcom is also confident that the DADDS file generation can be optimized and reduce the typical latency down closer to 10 seconds (or better). • Assuming an LRIT system latency of 20-25 seconds and a 5-10 second DADDS latency can be achieved, than it should be possible to achieve an average latency of 30 seconds. • Make suggested improvements and perform additional testing. Microcom Design, Inc.