Enhancing Water Productivity in Irrigated Commands: Challenges and Solutions
210 likes | 398 Vues
Explore irrigation management in command areas, factors affecting water use efficiency, challenges in food grain production, and ways to enhance water productivity. Learn about extendable technology in soybean, rice, wheat, and vegetables, and evaluate the performance of Water User Associations. Discover causes of variation in water productivity and significant findings.

Enhancing Water Productivity in Irrigated Commands: Challenges and Solutions
E N D
Presentation Transcript
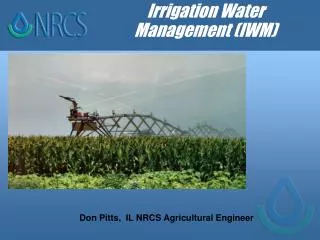
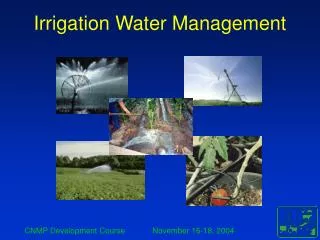
Irrigation Management in Command Areas COLLEGE OF AGRICULTURAL ENGINEERING JNKVV Jabalpur
Sources of losses Seepage Evaporation Total Main canal and Branches 13.6 3.4 17.0 Distributaries 6.4 1.6 8.0 Field and Water Courses 16.0 4.0 20.0 Field application losses 13.2 3.3 16.5 Total 49.2 12.3 61.5 Irrigation Efficiency at Field level
Factors affecting Water Use Efficiency • Genetic factors • Water use efficiency of C4 plant species such as maize, sorghum, sugarcane, pearl millet, finger miller etc is higher (3.14 to 3.44 mg dry weight/g of water) when compared to C3 species (1.49 to 1.59 mg dry weight/g of water) such as pulses, oilseed crops, wheat, barley, oats etc. • Climatic factors • Crop management factors Challenges • projected demand of about 450 million tones food grains by 2050. Challenge is therefore to achieve higher food grain production with reduced availability of water.
How to Enhance Water Productivity in Irrigated Commands • Improving control over water delivery and its potential impact • Changes in input use and potential impacts on water productivity • Potential impacts of improving quality of irrigation and water allocation • Allocating water across regions and productivity gains at the basin level
Water Management • Module 2 V for ADA/ADH and other officers • Surface irrigation methods • Drip irrigation method • Soil moisture measurement, scheduling of irrigation • Surface drainage • On farm reservoirs and water recycling • Participatory Irrigation Management • Watershed management • Canal distribution network
Extendable Technology Soybean : Ridge & Furrow system of sowing, Short duration variety • Average yield of soybean is rising from 9.8 to 15.9 q/ha (67% increase) • An average WUE change from 0.85 to 2.68 kg/cum. This is an increase of 110.7 to 743 %. • It was possible by adapting • Scientific package of practices • Ridge-furrow system of sowing, and • Short duration variety of soybean. • Maximum rise has been observed with ridge-furrow method of cultivation.
Rice: SRI Method, improved variety • SRI method in Rice cultivation and change in local variety resulted in • 44 percent rise in average yields and • 139 percent in WUE.
SRI Method in Rice Transplanting of 12 days nursery Crop at maturity stage Crop at 35 days age
Wheat: Improved production technology with irrigation scheduling Wheat shows a gain of 37 percent in yield and 69 percent in WUE.
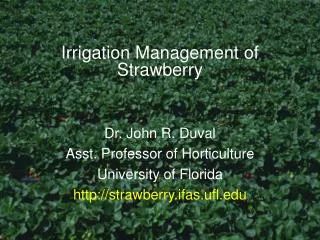
Vegetables: Improved variety • Due to change in local variety by improved variety the mean yields of vegetables • Yield increases by 55 percent • WUE increases by 191 percent.
Comparative Performance of Water User Association • Three WUAs Bijori, Bauchar and Govindgarh of Jabalpur, Narsinghpur and Rewa district • The aim was to find out the factors responsible for the functioning of Water User Association and its performance • To find out the factors responsible for project performance
Causes of Variation in Water Productivity • Evaluation of Project Performance through indicators on • Delivery • Maintenance • Financial • Sustainability • Evaluation of WUA Functions • Level of participation • Operation and management • Water management • Financial management • Organizational
Significant findings • Water productivity is highest 1.37 kg/m3 in WUA3 at Govindgarh. due to participation of water users in management • The tail-end supply ratio ( 0.67) is also highest • Medium farmers normally have GW source and hence apply water at appropriate time thus depicts higher WP • WP is lowest in head reach due to over irrigation.
Water Productivity of Wheat Under Drip Irrigation • Water productivity of drip irrigated wheat was 44.52% more than the flood irrigation • Water productivity was found maximum with one lateral in three rows with dripper placed at 30 cm.
Thanking You for the cause of water