Download
1 / 22
220 likes | 331 Vues
Forest Incomes and Sustainability after Uganda’s Forest Sector Governance Reform. SANREM Annual Meeting May 28 2008, Los Baños, Philippines. Pamela Jagger, Indiana University, USA Arthur Arinaitwe, Research Consultant, Uganda . Motivation for the study.

E N D
Forest Incomes and Sustainability after Uganda’s Forest Sector Governance Reform SANREM Annual Meeting May 28 2008, Los Baños, Philippines Pamela Jagger, Indiana University, USA Arthur Arinaitwe, Research Consultant, Uganda
Motivation for the study • Improved rural livelihoods and sustainability are among the expected outcomes of forest sector governance reforms • There is limited empirical evidence of the impact of reforms, particularly at the household level • There are often trade-offs between achieving favorable livelihood outcomes and sustainable forest management; are there conditions that favor both?
Forest sector reform in Uganda Motivation for reform • Government wide decentralization process • High rates of deforestation • Corruption in the centralized Forest Department • Need for coherent forest sector strategy Process • Forest Sector Umbrella Support Program 1998-2003 • New policy and legislation (2002/2003) • Forest Department disbanded and replace with: • District Forestry Service (DFS) (decentralization to local government) • National Forestry Authority (NFA) (for profit parastatal) • DFS and NFA overseen by Forestry Inspection Division
Research design Attributing causality between reforms and outcomes is a challenge • Data from before and after the reform • Counterfactual or control group Nested research design • Key informant interviews • Village level surveys • Household level surveys
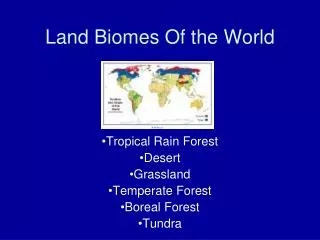
Budongo Forest Site (NFA) Bugoma Forest Site (DFS) Rwenzori Forest Site
Methods Treatment groups modeled in comparison to control group • Livelihood outcomes: Difference-in-difference estimator • Annual household income from forests • Annual total household income • Share of total annual household income from forests • Sustainability outcomes: • Households perceptions of change in forest cover/quality • Household participation in activities that contribute to deforestation
Livelihood outcomes, Bugoma (DFS) Controlling for household and village level characteristics: • Decline of $10 annual household income from forests • Increase of 2% in share of annual household income from forests • Highest income quartile households: • Increases in forest income ($2) • Increase in share of total income from forests (+10%) • Lowest income quartile households: • Decline in income from forests ($1) • Declines in share of income from forests (-7%)
Sustainability outcomes, Bugoma (DFS) Perceptions • Major decrease in: • Area under forest; Canopy cover • Major decrease in: • Diversity of tree species; Number of large trees in forest; Diversity of animal species Household participation in forest cover/quality change • 34% of households cleared forest (avg. of 1.33 acres per hhd.) • 4% of households harvested timber; Many migrant timber cutters working on contract in the area • Highest income quartile households most engaged in forest clearing (50%) and timber harvesting (11%)
Interpreting the findings, Bugoma (DFS) • The limited effect of the reform on livelihoods is not surprising given constraints facing the District Forest Service • Local resource users encounter barriers to entering the timber value-chain • There is limited knowledge in the area of the value of trees • Smallholders are allowing non-local extraction specialists to harvest timber trees for free or below market value • Securing land rights through forest clearing is contributing to forest cover loss
Policy recommendations, Bugoma (DFS) • Shift focus and capacity of DFO beyond timber revenue collection to extension, sustainable land management etc. • Facilitate District Forestry Officers with transportation • Develop a mechanism for smallholders to legally engage in timber harvesting • Support small and medium enterprise development to support localized value addition • Integrate tree planting, extension and input supply with agricultural extension • Transmission of timber price information to inform smallholders of the value of standing trees • Increase smallholder awareness and knowledge of sustainable pole harvesting
Livelihood outcomes, Budongo (NFA) Controlling for household and village level characteristics: • Increase of $44 annual household income from forests • Increase of 5% in share of annual household income from forests • Highest income quartile households: • Increases in forest income (+$184) • Significant increases in share of total income from forests (+32%) • Lowest income quartile households: • Declines in forest income (-$17) • Significant declines in share of income from forests (-16%)
Sustainability outcomes, Budongo (NFA) Perceptions • Within Central Forest Reserve • No major change in forest cover • Minor decrease in: • Diversity of tree species; Number of large trees • Private and community forests outside of reserve • Major declines in forest and canopy cover, tree species and diversity of trees and animals Household participation in forest cover/quality change • 10% of households cleared forest (avg. of 0.73 acres per household) • 14% of households harvested timber • Highest income quartile households most engaged in forest clearing (25%) and timber harvesting (40%)
Interpreting the findings, Budongo (NFA) • Large investment in NFA and increased presence around reserve correlated with illegal activity • Low salaries for NFA don’t favor enforcement • Evidence of collusion between NFA staff and timber producers • Engaging in the timber business requires capital and networks - the poor are excluded • Change in forest cover and quality consistent with forest disturbance from selective logging which has negative medium term ecological implications
Policy recommendations, Budongo (NFA) • Re-evaluate contract system and benefits for NFA contractors to reduce bribes and side payments from timber producers • Monitor distribution of benefits associated with forest products within communities • Persist with collaborative forest management agreements (cf. control group site) • Provide legal mechanism for sustainable harvesting of timber and poles by local resource users • Invest in tree planting on private and customary lands surrounding reserve (cf. control group site)
Thanks to: • Glenn Bush, University of Stirling and Andy Plumptre of the Wildlife Conservation Society (WCS) for sharing the baseline data used in this study • And the organizations who funded this research: • Center for International Forestry Research (CIFOR); • Collective Action and Property Rights Initiative (CAPRi) of the Consultative Group in International Agricultural Research (CGIAR); • National Science Foundation (NSF Grant number DDIG 0622392); • Social Sciences and Humanities Research Council of Canada (SSHRC); • Social Science Research Council (SSRC); • Sustainable Agriculture and Natural Resource Management Collaborative Research Support Program (SANREM CRSP, Grant number EPP-A-00-04-00013-00)
The Field Team From L to R: Issa Katwesige; Grace Nyesiga; Brian Isingoma; Samson Tweheyo; Arthur Arinaitwe (Team Leader); Shallon Kihembo
Low and medium value sawn wood price trends Prices adjusted for inflation; 1 USD=1817 UgShs.
High value sawn wood price trends Prices adjusted for inflation; 1 USD=1817 UgShs.