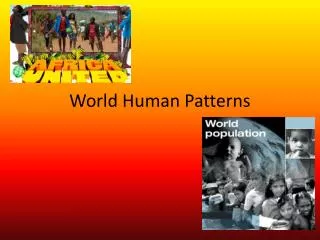
The Human World
The Human World. Revision Notes. The Human World. This unit is all about the human population on our planet and the places in which we live. The major themes are Population change and structure, and settlement location and layout. The World at night. Global Population Changes.


The Human World
E N D
Presentation Transcript
The Human World Revision Notes
The Human World • This unit is all about the human population on our planet and the places in which we live. • The major themes are Population change and structure, and settlement location and layout. The World at night
Global Population Changes • Global population has changed incredibly over the past 2000 years. Since the industrial revolution human numbers have literally exploded from only 1 billion people in 1600 to over 6 billion now. In 1999 D6B was official, the day of 6 billion people, and for the near future Global population shows no sign of slowing down. • Most of the population growth is found in LEDCs (Less Economically Developed Countries) such as China and India. • Africa’s population growth is large despite the Aids virus lowering life expectancy. • Most rich countries have stable populations (e.g. France and the USA) while some others have declining populations (e.g. Russia). • Population is not spread evenly over the globe, the map opposite shows the distribution of people. Most people live close to the coast and the most densely populated areas are found in SE Asia, Europe and parts of North America.
Birth and Death Rates, Natural Increase • Birth Rate is the term used to define the number of babies born every year per 1000 people in a population. • Death rate is the term used to define the number of deaths every year per 1000 people in a population. • Natural increase in a population occurs where Birth rate is greater than death rate. That is, that there are more births than deaths in that population ion a year. • Natural decrease occurs when death rate is greater than birth rate. This means that more deaths occur in a population than babies are born so population numbers decline. • Of course, this balance is change by Migration. If people move into a country (Immigrants) the population will increase. If people leave a country (emigrate) the population could decrease.
The Demographic Transition Model • This model shows the balance between birth and death rates and how this affects the population change. The model was based on how the UK’s population has changed.
Population Structures and Population Pyramids • A Population pyramid is a special graph that reveals the structure (how a population is made up) of a population. It divides a population into men and women, young, working population and retired. • MEDCs have a space rocket shape, with old people living for a long time (high life expectancy), lots of workers and a reason able numbers of children. These populations are stable and not growing as the number of young is balanced with the number of people dieing. • LEDCs have a triangular shaped pyramid. They have lots of children and people do not tend to live for a long time (low Life expectancy).
Dependency ratios Pakistan • This is mathematical formula used to calculate how many people work in comparison to how many people need looking after. The population that need looking after (the dependent population) are the old (65+) and very young (0 – 14). The working population are known as the economically active. • The formula is % pop aged 0 to 14 + % population aged 65+ % of people aged 15 to 65 In MEDCs the ratio is normally between 50 and 75. In LEDCs it is higher, often over 100, because of the number of children in their population. New Zealand
The Differences Between rural and Urban Populations • Rural areas are areas where the dominant economic activity is often farming and they are often located in the countryside. • In LEDCs in the countryside there is likely to be a shortage of young males as these men have migrated too cities looking for work. They may return to their rural villages once thy have earned enough money. In contrast, urban area have population pyramids that have lots of young economically active males.
The Differences Between rural and Urban Populations • In MEDCs there is also a movement of young working age from rural areas (e.g. Bedlington) to urban areas (e.g. Newcastle). There is also a movement of people from urban to rural areas where • People retire to the countryside • Couples move to the countryside in search of a better environment to raise their families.
Impact of an ageing population • MEDCs face increasing problems as populations become older and have less children. • Birth rates are falling in these countries as families have less children and fertility rates fall. • Life expectancy increases because of improved medical care and improved nutrition and food availability. • This poses numerous problems such as; • There are less working age population to provide tax money for the services (medical care and social services such as meals on wheels etc) the elderly need. • Strain is put on existing services such as the NHS (in winter a lot of hospital beds and doctor’s time are taken by the elderly. • There are not enough facilities for the elderly e.g. care and residential homes • The cost of providing for pensions increases, Britain at the moment is facing a pensions crisis. More Developed regions population pyramid
Solutions to an ageing population • Convert old school buildings into residential homes. • Raise taxes to provide the elderly with high quality services. • Force people to save for a pension so that they are comfortable in old age. • Offer tax breaks, free child care and cash to families to encourage them to have more children. This will eventually help as these children will become the workers who provide for the old.
Impact of a Youthful population A youthful population is one in which there are large numbers of children, the base of the population pyramid will be large. In some African countries such as Mali over 40% of the population is under the age of 15. This creates numerous problems for the country such as; • Economic problems, as the country tries to provide for the children with education, health care and food. • Attendance at secondary schools in rural areas is low leaving lots of unqualified poorly educated workers. • Disease rates amongst young children are high as the government cannot afford medicines for them, even for preventable diseases such as measles and diarrhoea. This means Infant mortality is high. There are also few doctors and hospitals in these countries. • Because there are lots of children who have yet to have their own children in the future the situation can only grow worse.
Solutions to the problems of a youthful population • Family planning programmes could help LEDCs. China introduced a one child policy where couples were limited to one child per family. People have to apply for a license to have a child and are carefully monitored by the government. If families have more than one child they lose their benefits and have to pay back any benefits they received for their first child (e.g. child care benefits). • This policy has its limits, children not having brothers and sisters, no Uncles or aunts etc. It is hoped that it will slow down and over time eventually reduce China’s population (already over 1 billion people live in China!) • What do you think about it? • In Mauritius a family planning programme was also implemented. Mauritius is a small island that had a rapidly growing population. Here families were given classes in the advantages of smaller families and on birth control methods. In addition, the government introduced research and scientific industries to the island in order to provide more job opportunities for its people rather than just primary farming jobs.
The Physical factors which affect the site of settlements • Physical factors that influence the location of a settlement include; • Water supply – settlements need water, they often locate on wet point sites for this. Settlements built away from rivers and water supplies to avoid flooding are located at dry point sites. • Defence – building on high ground allowed people the chance to look out for enemies (e.g. Edinburgh castle) while surrounding a settlement with water also helped with deed defence e.g. Durham is built inside a meander. • Aspect and shelter – In the northern hemisphere south facing slopes receive more sunlight and are protected from cold Northerly winds. More settlements and agricultural land is therefore located on South facing slopes.
Settlements key terms • A settlement is a collection of buildings where people live. They vary in size from small hamlets to large cities. • Site is the actual land that a settlement is built upon. The photo shows Warkworth, what advantages will this site bring to the settlement? • Situation is the land and area that surround a settlement that make a site a good place to locate a settlement.
The economic factors influencing the sites of settlements • Communications – settlements often located next to rivers that could be easily crossed. These are called bridging points. Other favourable places included where at the junctions of valleys or in gaps through hills. These locations allowed maximum communication between different settlements and increased trade. E.g. Newcastle is built on the Tyne at a bridging point and could benefit with trade from the North and the South. • Resources - Early settlers relied upon wood for fuel and building. A site close to woodland was there fore an advantage. Later, resources such as Iron ore, coal and bauxite encouraged the growth of settlements.
Settlement shapes • There are 3 different shapes of settlement according to the arrangement of buildings within them; • Linear settlements grow in a line, often along roads, river valleys or the coast. • Nucleated settlements have buildings grouped close together and are found at cross roads or are used for defence purposes. • Dispersed settlements have individual buildings spread out, and are often found in rural areas.
Characteristics of an urban area in an MEDC • There are 2 models that describe land use within cities in MEDCs. • The Burgess model suggests that cities grow outwards in concentric rings (circles!) • The Hoyt model suggests that cities grow in sectors or wedges along communication lines such as roads, rivers and rail. • In zone 1 you find the original site of the settlement where the city originally started. Here there is a Central Business District containing services, education facilities and businesses. • In zone 2 there is a mixture of old industrial housing, often terraces, and industry. These areas would have been constructed in the industrial revolution. • Zone 3 is another area of low class residential housing. • Zone 4 contains medium class residential housing tat was built between the 2 world wars. Often semi detached housing and council estates. • Zone 5 is an expensive area of housing found at the edge of cities.
Characteristics of an urban area in an LEDC • There has been massive growth in urban areas in LEDCs. • The land use model is different to those for MEDCs because; • There are slum or shanty town areas where there is no planning of the settlement and the people lie there illegally. • The rich live close to the CBD, in MEDCs the richest people live on the outskirts of cities.
Urban structure in Newcastle-upon-Tyne How does this compare with the urban land use models of Burgess and Hoyt?
Urban structure in Newcastle-upon-Tyne What type of housing is this? How can you tell? How much open space is there? What facilities are there for the community? What transport is there? Can you identify the edge of the CBD?How can you tell? What type of housing is this? How can you tell? How much open space is there? What facilities are there for the community? What is the land use of this area here?