Download
1 / 13
130 likes | 154 Vues
This presentation discusses the impact of different ethanol blends on emission estimates and the need for air quality considerations when changing fuels. It explores the sensitivity analysis of ethanol and fuel formulation parameters, as well as the comparison to literature findings. The presentation concludes with important insights for modelers and highlights the ongoing development in this area by the EPA.

E N D
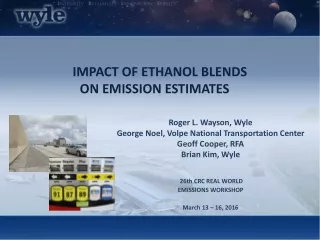
IMPACT OF ETHANOL BLENDS ON EMISSION ESTIMATES Roger L. Wayson, Wyle George Noel, Volpe National Transportation Center Geoff Cooper, RFA Brian Kim, Wyle 26th CRC REAL WORLD EMISSIONS WORKSHOP March 13 – 16, 2016
Overview of Presentation Background Test Parameters and MOVES Information Fuel Wizard Ethanol Sensitivity Analysis and Fuel Formulation Parameter Sensitivity Analysis Splash Blend Analysis Comparison to Literature Conclusions
Reasons for the Project • Ethanol has become a major consideration for use as an alternate fuel worldwide • E10 is now a typical fuel in the U.S. • Use of ethanol is growing and different blends being considered • We need to consider air quality impacts from fuel changes • Emission modeling is crucial to this process Source Hanskeuken
MOVES Fuel Adjustment Factors • MOVES has been continually developed based on the use of fuel adjustment factors since MOVES2009 • Example • Fuel Corrected Emissions = (Fuel Adjustment Factor of Target Fuel) x (Base Emissions Factor) • Fuel Adjustment Factor of Target Fuel = (Emissions of Target Fuel) / (Emissions of Base Fuel)
Specific Fuel Information in MOVES • Defined fuel types with a subtype ID • RVP (Reid Vapor Pressure) • Sulfur level • ETOH volume (Ethanol) • MTBE volume • ETBE volume (Ethyl Tertiary Butyl Ether) • TAME volume (Tertiary-Amyl Methyl Ether) • Aromatic content • Olefin content • Benzene content • e200 (distillation temperature related to fuel properties) • e300 • Volume-to-weight percentage of oxygen Ethanol IDs 12, 13, 14, 51, 52, and 53 Fuel Regions
Test Parameters Consideration PDM* kept constant except for fuel supply and fuel formulation input Restricted Access at 35 MPH Unrestricted Access at 50 MPH *Project Data Manager
Fuel Property Ranges Thousands of fuels make up the MOVES2014 master fuel list with 75 unique E10 and E15 in the default database so limits established.
Results of Fuel Wizard Sensitivity Analysis • Differences by Drive Cycles and Facility Types (Unrestricted ) • Differences by Fuel type Example: Hydrocarbons VOC THC
Splash Blend Analysis Differences by Regional Splash Blends Occur As Well
Subset of Conclusions • Important note for modelers: Automatic adjustment of other fuel parameters occur as ethanol content is changed using MOVES2014…..BUT…for E20 and above other properties are not automatically adjusted requiring manual adjustment. • Some emissions are predicted to increase and others decrease when increasing ethanol blends are analyzed, with different trends and sometimes unexpected (e.g. SO2 increases with increased content). • For more accuracy in predictions, manual adjustment for fuel parameters may be needed in the Fuel Formulation and Fuel Supply Tables, especially with the real-world splash blends as compared to match blends. • Results from literature show that more work is needed and EPA is continuing development.