Download
1 / 9
90 likes | 110 Vues
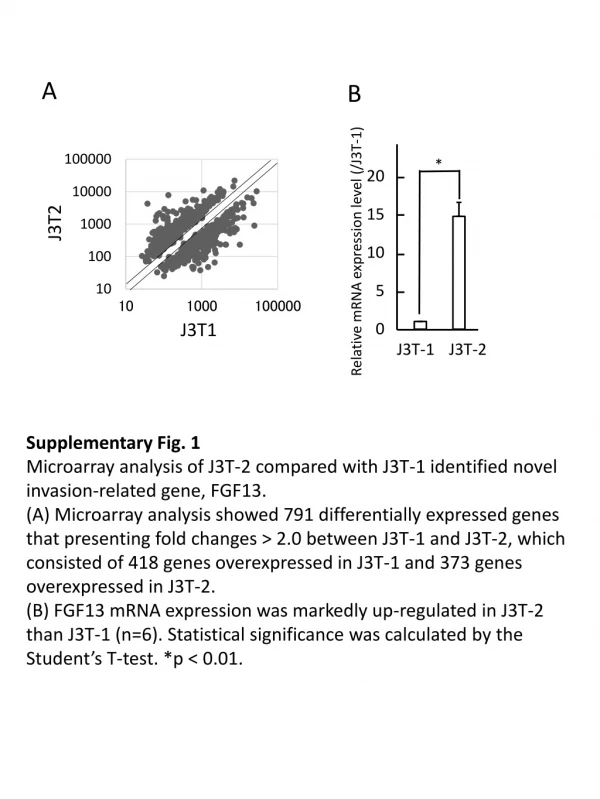
A. B. *. J3T2. Relative mRNA expression level (/J3T-1). J3T1. J3T-1. J3T-2. Supplementary Fig. 1 Microarray analysis of J3T-2 compared with J3T-1 identified novel invasion-related gene, FGF13.

E N D
A B * J3T2 Relative mRNA expression level (/J3T-1) J3T1 J3T-1 J3T-2 SupplementaryFig.1 Microarray analysis of J3T-2 compared with J3T-1 identified novel invasion-related gene, FGF13. (A) Microarray analysis showed 791 differentially expressed genes that presenting fold changes > 2.0 between J3T-1 and J3T-2, which consisted of 418 genes overexpressed in J3T-1 and 373 genes overexpressed in J3T-2. (B) FGF13 mRNA expression was markedly up-regulated in J3T-2 than J3T-1 (n=6). Statistical significance was calculated by the Student’s T-test. *p< 0.01.
A CD31 FGF13 B FGF13 Iba-1 SupplementaryFig.2 Microenvironmental cells like endothelial cells or macrophages did not express FGF13. Serial section analysis in immunohistochemistry revealed that tumor cells expressed FGF13 (arrow head), however, endothelial cells (arrow, A) or macrophages (arrow, B) did not express FGF13. Scale bar, 50 μm
SupplementaryFig.3 FGF13 expression in glioma subtypes.
A B siRNA NC #1 #2 U87ΔEGFR A172 J3T-2 * p=0.08 J3T-2 * * * Relative ratio of invasion cells (/NC) U87ΔEGFR NC #2 #1 NC NC #1 #2 #1 #2 siRNA siRNA siRNA A172 C D Gli36Δ5 A172 * * Relative ratio of migration cells (/NC) Relative FGF13 mRNA expression level (/NHA) NC NC #2 #1 #1 #2 NHA A172 Gli36Δ5 siRNA siRNA SupplementaryFig.4 FGF13 was involved in glioma invasion in vitro. (A, B) Knockdown of FGF13 by siRNA decreased the invasion activity of J3T-2 and U87ΔEGFR cells (n=10). In contrast, silencing of FGF13 did not affect the invasion activity of A172 (n=10). (C) A172 and Gli36Δ5 cell lines expressed very low levels of FGF13 (n=6) compared with that of normal human astrocyte (NHA). (D) Silencing of FGF13 did not affect the migration activity of A172 and Gli36Δ5 cells. Data are shown as the mean ± SEM. Statistical significance was calculated by ANOVA with the Dunnett’s post hoc test. *p< 0.05. NC = negative control siRNA.
A siRNA siRNA siRNA siRNA NC #1 #2 NC #1 #2 NC #1 #2 NC #1 #2 TUNEL DAPI MERGE U87ΔEGFR J3T-2 LNZ308 U251 B U87ΔEGFR U251 LNZ308 J3T-2 p=0.86 p=0.70 p=0.62 p=0.82 % TUNEL-positive cells #2 NC #1 #2 NC #1 #2 #2 NC #1 NC #1 siRNA siRNA siRNA siRNA SupplementaryFig.5 Silencing of FGF13 did not induce apoptosis of glioma cell lines in vitro. (A) Representative pictures from five experiments are shown. TUNEL-positive cells, green; DAPI = 4, 6-diamidino-2-phenylindole, blue. Bar = 50 μm. (B) Silencing of FGF13 did not induce apoptosis of glioma cell lines in vitro. (n=5) Statistical significance was calculated by ANOVA with Dunnett’s post hoc test.
D C A Ipsilateral Contralateral * * * * * * MIB-1 index (%) scramble #1 #2 Relative FGF13 mRNA expression level (/scramble)z Invading cells (/scramble) Invading cells (/scramble) shRNA E scramble #1 #2 scramble #1 #2 scramble #2 #1 Vessel density (/HPF) shRNA shRNA shRNA scramble #1 #2 B F Contralateral Ipsilateral shRNA scramble shRNA FGF13 shRNA#1 FGF13 shRNA#2 ** ** 100 80 60 Survival(%) 40 20 0 10 20 30 40 50 60 70 SupplementaryFig.6 FGF13 was involved in glioma invasion in MGG23 and reduction of FGF13 improved overall survival. (A) The relative expression level of FGF13 mRNA was decreased by shRNA in MGG23 cells (n = 3). (B, C) Knockdown of FGF13 in MGG23 impaired glioma invasion as well as MGG8 (n=3). Scale bars, 50 µm. (D, E) Silencing of FGF13 had no effect on cell proliferation and angiogenesis (n=3). (D) Kaplan-Meier survival curves of intracranial xenografts with MGG23 cells expressing FGF13 shRNA#1, FGF13 shRNA#2, or scramble shRNA. The survival time of MGG23 expressing either FGF13 shRNA#1 or FGF13 shRNA#2 (median survival = 68 or 65.5 days, respectively) were significantly longer than that of scramble shRNA (58days) (n=8). *p< 0.01, **p < 0.05 Days after implantation (days)
A B * * * * Relative FGF13B expression (/Normoxia) Relative CA9 mRNA expression level (/DMSO) Relative FGF13B expression (/DMSO) Relative CA9 mRNA expression level (/Normoxia) DMSO DMSO DFOM DFOM Hypoxia Hypoxia Normoxia Normoxia C D * * * * Relative FGF13B expression (/Normoxia) Relative CA9 mRNA expression level (/Normoxia) Relative CA9 mRNA expression level (/DMSO) Relative FGF13B expression (/DMSO) DMSO DMSO DFOM DFOM Hypoxia Hypoxia Normoxia Normoxia SupplementaryFig.7 The FGF13 expression was negatively regulated by hypoxia. (A, C) The relative expression of CA9 mRNA, which is a marker of hypoxic condition, was significantly up-regulated by 1% O2 (hypoxia) or deferoxamine mesylate (DFMO) in both U87ΔEGFR (A) and U251 (C) (n=3). (B, D) The relative expression of FGF13B protein was significantly decreased by 1% o2 (hypoxia) or deferoxamine mesylate (DFMO) in both U87ΔEGFR (B) and U251 (D) (n=4). Data are shown as the mean ± SEM. Statistical significance was calculated by the Student’s T-test. *p< 0.05.
* D A B C * * * * * Relative ratio of invasion cells (/control) Relative FGF13B expression Tumor Core Invasion edge control control Bev + #1 Bev + #1 Bev + NC Bev + NC Bev + #2 Bev + #2 Pre-bev Pre-bev Post-bev Post-bev siRNA siRNA E F Newly-diagnosed(Pre-bev) Post-bev G SupplementaryFig.8 Silencing of FGF13 decreased bevacizumab-induced invasion. (A, B) Western blotting of U87ΔEGFR (A) and U251 (B) showed that the expression level of FGF13B did not alter after bevacizumab treatment (n=4). Statistical significance was calculated by the Student’s T-test. (C, D) Double chamber assays showed that bevacizumab induced glioma invasion, but silencing of FGF13 inhibited the invasion of U87ΔEGFR (C) and U251 (D) (n=3). Statistical significance was calculated by Tukey’s post hoc test. NC = negative control siRNA. (E) Immunohistochemical staining of a human glioma specimen (case 25) showed FGF13 was expressed after bevacizumab treatment. (F, G) Immunohistochemical staining of U87ΔEGFR cells transfected with scramble shRNA treated with bevacizumab showed bevacizumab-induced invasion (F). In contrast, silencing of FGF13 decreased the invasiveness (G). The representative results are shown. Data are shown as the mean ± SEM. *p< 0.05.
Fig. 2B Fig. 1E FGF13 FGF13 25kD 25kD Actin Actin Fig. 5C Fig. 5B Acetylated-tubulin FGF13 FGF13 75kD 25kD U87ΔEGFR Tyrosinated-tubulin U251 Actin Actin Fig. 6A FGF13 25kD Actin SupplementaryFig.9 Full scans of the immunoblots shown in the figure. Boxes indicated parts used in the figure and numbers indicated molecular weights.