Quantity of Computers Produced
70 likes | 239 Vues
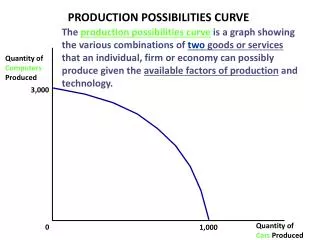
0. PRODUCTION POSSIBILITIES CURVE. The production possibilities curve is a graph showing the various combinations of two goods or services that an individual, firm or economy can possibly produce given the available factors of production and technology. Quantity of Computers Produced.

Quantity of Computers Produced
E N D
Presentation Transcript
0 PRODUCTION POSSIBILITIES CURVE The production possibilities curveis a graph showing the various combinations of two goods or services that an individual, firm or economy can possibly produce given the available factors of production and technology. Quantity of Computers Produced 3,000 Quantity of CarsProduced 1,000
A 2,000 700 0 • The line represents the limit of our production capabilities-the production possibilities frontier. • Production on the line represents full employment, efficient use of resources. Quantity of Computers Produced • This economy can use all of its resources to produce 3,000 computers OR 1,000 cars OR lesser amounts of both. 3,000 Quantity of Cars Produced 1,000
C 2,200 A 2,000 700 0 600 • Changes in the production amounts of the two goods result in opportunity costs – we must give up some of the other to get more of what we want. Quantity of Computers Produced If we choose to produce 200 more computers we must give up 100 cars. 3,000 Quantity of Cars Produced 1,000
A 2,000 B 1,000 700 0 300 Production at point B is possible but represents less than full employment of resources or the inefficient use of resources. Another term is underutilization of resources. Production can be increased of either cars or computers without incurring an opportunity cost. We were not using all of our resources so we would not have to give up producing cars to get more computers. Quantity of Computers Produced 3,000 Quantity of Cars Produced 1,000
D 0 Production at D is not possible. The line represents full use of available resources. D is beyond our production possibilities frontier. Quantity of Computers Produced Production at D is not possible except in the very short run. We can run our factories 24/7 and workers can work 2 jobs or overtime. But this is not sustainable. 3,000 Quantity of Cars Produced 1,000
4,000 E 2,100 750 Quantity of Computers Produced The development of new technology or the presence of more resources allows us to increase our production possibilities – the curve shifts out. This shift is known as economic growth. 3,000 2,000 A Quantity of Cars Produced 700 0 1,000