Chapter 54
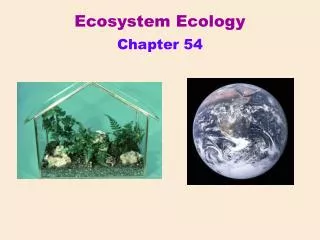
Ecosystem Ecology. Chapter 54. Ecosystem – all the organisms living in a community, plus all the abiotic factors with which they interact. From a small “closed system” to the biosphere. Two principal ecosystem processes: energy flow & chemical cycling. Tertiary consumers.

Chapter 54
E N D
Presentation Transcript
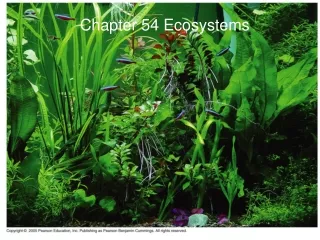
Ecosystem Ecology Chapter 54
Ecosystem – all the organisms living in a community, plus all the abiotic factors with which they interact From a small “closed system” to the biosphere
Two principal ecosystem processes: energy flow & chemical cycling Tertiary consumers Microorganisms and other detritivores Secondary consumers Primary consumers Detritus Primary producers Fig. 54.2 Heat Key Chemical cycling Sun Energy flow Energy flows through an ecosystem (energy from the sun ultimately dissipates into space as heat)
Two principal ecosystem processes: energy flow & chemical cycling Tertiary consumers Microorganisms and other detritivores Secondary consumers Primary consumers Detritus Primary producers Fig. 54.2 Heat Key Chemical cycling Sun Energy flow Chemical elements are continually recycled
Two principal ecosystem processes: energy flow & chemical cycling Tertiary consumers Microorganisms and other detritivores Secondary consumers Primary consumers Detritus Primary producers Fig. 54.2 Heat Key Chemical cycling Sun Energy flow Physical laws govern these processes
Two principal ecosystem processes: energy flow & chemical cycling Tertiary consumers Microorganisms and other detritivores Secondary consumers Primary consumers Detritus Primary producers Fig. 54.2 Heat Key Chemical cycling Sun Energy flow 1st Law of Thermodynamics: Conservation of Energy
Two principal ecosystem processes: energy flow & chemical cycling Tertiary consumers Microorganisms and other detritivores Secondary consumers Primary consumers Detritus Primary producers Fig. 54.2 Heat Key Chemical cycling Sun Energy flow 2nd Law of Thermodynamics: Energy transformation is inefficient (between trophic levels)
Two principal ecosystem processes: energy flow & chemical cycling Tertiary consumers Microorganisms and other detritivores Secondary consumers Primary consumers Detritus Primary producers Fig. 54.2 Heat Key Chemical cycling Sun Energy flow Primary producers take elements in inorganic molecules and incorporate them into organic molecules
Two principal ecosystem processes: energy flow & chemical cycling Tertiary consumers Microorganisms and other detritivores Secondary consumers Primary consumers Detritus Primary producers Fig. 54.2 Heat Key Chemical cycling Sun Energy flow Additional organic molecules are produced at other trophic levels
Two principal ecosystem processes: energy flow & chemical cycling Tertiary consumers Microorganisms and other detritivores Secondary consumers Primary consumers Detritus Primary producers Fig. 54.2 Heat Key Chemical cycling Sun Energy flow Organic molecules are broken down into inorganic molecules by metabolism and decomposition of detritus
Energy budgets Gross primary production (GPP) the amount of light energy converted to chemical energy per unit time (by primary producers through photosynthesis) Net primary production (NPP) GPP minus energy used by primary producers for respiration NPP = GPP - R
Energy budgets 125 Open ocean 24.4 65.0 360 Continental shelf 5.2 5.6 1,500 Estuary 0.3 1.2 Algal beds and reefs 2,500 0.1 0.9 Upwelling zones 0.1 500 0.1 Extreme desert, rock, sand, ice 3.0 4.7 0.04 0.9 90 Desert and semidesert scrub 3.5 Tropical rain forest 2,200 22 3.3 2.9 Savanna 900 7.9 9.1 2.7 Cultivated land 600 Boreal forest (taiga) 9.6 2.4 800 1.8 Temperate grassland 600 5.4 Woodland and shrubland 700 1.7 3.5 Tundra 0.6 1.6 140 Tropical seasonal forest 1,600 7.1 1.5 Temperate deciduous forest 1,200 1.3 4.9 1,300 Temperate evergreen forest 1.0 3.8 0.4 Swamp and marsh 2,000 2.3 Lake and stream 0.4 250 0.3 0 10 20 30 40 50 60 0 500 1,000 1,500 2,000 2,500 0 5 10 15 20 25 Key (b) Average net primary production (g/m2/yr) (a) Percentage of Earth’s surface area (c) Percentage of Earth’s net primary production Marine Figure 54.4 Terrestrial Freshwater (on continents) Different ecosystems vary in overall size (Fig. a), NPP (Fig. b), and their contributions to total NPP on Earth (Fig. c)
Energy budgets 125 Open ocean 24.4 65.0 360 Continental shelf 5.2 5.6 1,500 Estuary 0.3 1.2 Algal beds and reefs 2,500 0.1 0.9 Upwelling zones 0.1 500 0.1 Extreme desert, rock, sand, ice 3.0 4.7 0.04 0.9 90 Desert and semidesert scrub 3.5 Tropical rain forest 2,200 22 3.3 2.9 Savanna 900 7.9 9.1 2.7 Cultivated land 600 Boreal forest (taiga) 9.6 2.4 800 1.8 Temperate grassland 600 5.4 Woodland and shrubland 700 1.7 3.5 Tundra 0.6 1.6 140 Tropical seasonal forest 1,600 7.1 1.5 Temperate deciduous forest 1,200 1.3 4.9 1,300 Temperate evergreen forest 1.0 3.8 0.4 Swamp and marsh 2,000 2.3 Lake and stream 0.4 250 0.3 0 10 20 30 40 50 60 0 500 1,000 1,500 2,000 2,500 0 5 10 15 20 25 Key (b) Average net primary production (g/m2/yr) (a) Percentage of Earth’s surface area (c) Percentage of Earth’s net primary production Marine Figure 54.4 Terrestrial Freshwater (on continents) Terrestrial ecosystems contribute about 2/3 and marine ecosystems about 1/3 of global NPP
Energy budgets Resources limit primary production (just as they limit population growth) Resources = light, water, nutrients For example, large-scale manipulations often demonstrate N or P limitation of NPP Figure 54.7
3,000 Tropical forest 2,000 Net primary production (g/m2/yr) Temperate forest 1,000 Mountain coniferous forest Desert shrubland Temperate grassland Arctic tundra 0 500 1,000 1,500 Actual evapotranspiration (mm H2O/yr) 0 Energy budgets For example, actual evapotranspiration correlates well with NPP across biomes Figure 54.8
3,000 Tropical forest 2,000 Net primary production (g/m2/yr) Temperate forest 1,000 Mountain coniferous forest Desert shrubland Temperate grassland Arctic tundra 0 500 1,000 1,500 Actual evapotranspiration (mm H2O/yr) 0 Energy budgets Actual evapotranspiration is the amount of water transpired plus evaporated (a function of water availability and solar energy) Figure 54.8
Energy budgets Secondary production is the amount of chemical energy in consumers’ food converted to consumer biomass Some energy at each trophic level remains unassimilated (uneaten; not shown in the fig.) Plant material eaten by caterpillar 200 J 67 J Cellular respiration 100 J Feces 33 J Figure 54.10 Growth (new biomass)
Energy budgets Secondary production is the amount of chemical energy in consumers’ food converted to consumer biomass Some assimilated energy is passed in waste, some is used in respiration, and the rest is net secondary production Plant material eaten by caterpillar 200 J In this example, <17% is used for secondary production 67 J Cellular respiration 100 J Feces 33 J Figure 54.10 Growth (new biomass)
Tertiary consumers 10 J Secondary consumers 100 J Primary consumers 1,000 J Primary producers 10,000 J 1,000,000 J of sunlight Energy budgets Trophic efficiency is the percentage of production transferred from one trophic level to another Primary producers only convert ~1% of sunlight Other trophic levels ~10% (5% to 20%) Figure 54.11
Tertiary consumers 10 J Secondary consumers 100 J Primary consumers 1,000 J Primary producers 10,000 J 1,000,000 J of sunlight Energy budgets Pyramid of net production Primary producers only convert ~1% of sunlight Other trophic levels ~10% (5% to 20%) Figure 54.11
Energy budgets Pyramid of biomass The standing crop at each trophic level Usually narrows from the base upwards Dry weight (g/m2) Trophic level Tertiary consumers 1.5 Secondary consumers 11 37 Primary consumers Primary producers 809 Figure 54.12
Energy budgets Pyramid of biomass The standing crop at each trophic level But sometimes increases upwards if primary producers turn over rapidly Dry weight (g/m2) Trophic level 21 Primary consumers (zooplankton) Primary producers (phytoplankton) 4 Figure 54.12
Number of individual organisms Trophic level Tertiary consumers 3 Secondary consumers 354,904 Primary consumers 708,624 Primary producers 5,842,424 Energy budgets Pyramid of numbers Predators tend to be larger than prey, so pyramids of numbers nearly always narrow upwards E.g., field in Michigan Figure 54.13
Trophic level Secondary consumers Primary consumers Primary producers Energy budgets Pyramid of numbers For a given amount of grain, carnivorous humans fair worse than vegetarians! Figure 54.13
Reservoir a Reservoir b Organic materials available as nutrients Organic materials unavailable as nutrients Fossilization Living organisms, detritus Coal, oil, peat Respiration, decomposition, excretion Burning of fossil fuels Reservoir d Reservoir c Inorganic materials unavailable as nutrients Inorganic materials available as nutrients Weathering, erosion Atmosphere, soil, water Minerals in rocks Formation of sedimentary rock Biogeochemical cycles Earth is nearly a closed system with respect to amounts of elements (with the exception of minor additions and losses, e.g., meteorites) Assimilation, photosynthesis Figure 54.16
Reservoir a Reservoir b Organic materials available as nutrients Organic materials unavailable as nutrients Fossilization Living organisms, detritus Coal, oil, peat Respiration, decomposition, excretion Burning of fossil fuels Reservoir d Reservoir c Inorganic materials unavailable as nutrients Inorganic materials available as nutrients Weathering, erosion Atmosphere, soil, water Minerals in rocks Formation of sedimentary rock Biogeochemical cycles The general biogeochemical cycle of an element (see fig.) Elements cycle among pools that vary in whether they are: (1) incorporated in organic vs. inorganic molecules, or (2) available vs. unavailable to organisms Assimilation, photosynthesis Figure 54.16
THE WATER CYCLE Major reservoir is the ocean (which contains about 97% of Earth’s water) Solar energy Transport over land Net movement of water vapor by wind Precipitation over land Evaporation from ocean Key processes include evaporation, transpiration, condensation in clouds, and precipitation Precipitation over ocean Evapotranspiration from land Percolation through soil Runoff and groundwater Figure 54.17
THE CARBON CYCLE Major reservoirs with “fast” turnover include fossil fuels, soils, dissolved carbon compounds in the oceans, biomass, CO2 CO2 in atmosphere Photosynthesis Cellular respiration Burning of fossil fuels and wood The largest pool is sedimentary rock, but turnover is very slow Higher-level consumers Primary consumers Carbon compounds in water Detritus Decomposition Figure 54.17
THE CARBON CYCLE Key processes are photosynthesis, respiration, burning of fossil fuels, volcanoes CO2 in atmosphere Photosynthesis Cellular respiration Burning of fossil fuels and wood Higher-level consumers Primary consumers Carbon compounds in water Detritus Decomposition Figure 54.17
THE PHOSPHORUS CYCLE Major reservoirs are sedimentary rocks, soils, oceans, and biomass Rain Weathering of rocks Geologic uplift Runoff Key processes include weathering of rocks and decomposition; little cycling in the atmosphere Consumption Plant uptake of PO43 Sedimentation Soil Leaching Decomposition Figure 54.17
THE NITROGEN CYCLE Major reservoir is the atmosphere (which is about 80% N2) N2 in atmosphere Key process for N to enter an ecosystem is fixation, the conversion of N2 by bacteria (or lightning) to forms usable by plants Decomposers Assimilation Denitrifying bacteria NO3 Nitrogen-fixing bacteria in root nodules of legumes Nitrifying bacteria Ammonification Nitrification NO2 NH4+ NH3 Nitrogen-fixing soil bacteria Nitrifying bacteria Figure 54.17
Humans have dramatically altered biogeochemical cycles and ecosystems The Hubbard Brook, NH experiment demonstrates the importance of forests for nutrient cycling Whole watersheds were experimentally deforested or not Figure 54.19
Humans have dramatically altered biogeochemical cycles and ecosystems The Hubbard Brook, NH experiment demonstrates the importance of forests for nutrient cycling Weirs measured nutrient loss from watersheds Figure 54.19
Humans have dramatically altered biogeochemical cycles and ecosystems The Hubbard Brook, NH experiment demonstrates the importance of forests for nutrient cycling 80.0 Deforested 60.0 40.0 20.0 Nitrate concentration in runoff (mg/L) Completion of tree cutting 4.0 Control 3.0 2.0 1.0 0 1967 1965 1966 1968 Deforested watersheds lost nutrients at prodigious rates Figure 54.19
Field pH 5.3 5.2–5.3 5.1–5.2 5.0–5.1 4.9–5.0 4.8–4.9 4.7–4.8 4.6–4.7 4.5–4.6 4.4–4.5 4.3–4.4 4.3 Humans have dramatically altered biogeochemical cycles and ecosystems Oxides of sulfur and nitrogen from burning of fossil fuels have formed sulfuric and nitric acid, which have acidified soils Figure 54.22
1.05 390 0.90 380 0.75 370 Temperature 0.60 360 0.45 CO2 concentration (ppm) 350 Temperature variation (C) 0.30 340 CO2 0.15 330 0 320 0.15 310 0.30 0.45 300 1975 1980 1985 1990 1995 2000 2005 1960 1965 1970 Year Humans have dramatically altered biogeochemical cycles and ecosystems Anthropogenic CO2 is the direct cause of global warming and various other manifestations of climate change Figure 54.24