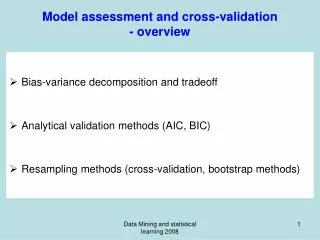
Download
1 / 33
330 likes | 468 Vues
HIRDLS Validation Overview (V003, v2.04.09) B. Nardi, J. Gille, J. Barnett, D. Kinnison, S. Massie, M. Coffey, C. Randall, V. L. Harvey, A. Waterfall, J. Reburn, J. Alexander & HIRDLS Team HIRDLS Science Meeting Oxford, June 26, 2008. Overview. Validation Operations & Efforts to date

E N D
HIRDLS Validation Overview (V003, v2.04.09) B. Nardi, J. Gille, J. Barnett, D. Kinnison, S. Massie, M. Coffey, C. Randall, V. L. Harvey, A. Waterfall, J. Reburn, J. Alexander & HIRDLS Team HIRDLS Science Meeting Oxford, June 26, 2008
Overview Validation Operations & Efforts to date Temperature validation Ozone validation Nitric Acid validation Cloud counting/height validation Products Status Summary
Airborne Ground/Lidar-Bal. Satellite HIRDLS Validation HIRDLS Review HIRDLS Operational Launch V002(v2.02.07) V003(v2.04.09) ~ V004 ~ 2004 2005 2006 2007 2008 ST30 ST13 L.Bal. ST23 L.Bal. • P-AVE = Polar AURA Validation Experiment 2005 1/24-2/9 (M. Schoeberl, E. Jensen) • H-AVE = Houston AURA Validation Experiment, 2005 6/9-7/7 (P. Newman, D. Fahey) • CR-AVE = Costa Rica AURA Validation Experiment, 2006 1/9-2/11 (P. Newman, E. Jensen) • INTEX-B = Intercontinental Chemical Transport Experiment, 2006 3/1–5/12 (M. Gaunce, H. Singh, M. Schoeberl ) • TC4 = Tropical Composition, Cloud and Climate Coupling, 2007 6/26–8/13 (D. Starr, B. Toon) • ARCTAS = Arctic Research of the Composition of the Troposphere from Aircraft and Satellites, 2008 Apr 1-21 (K. Shiffer, D. Jacob, H. Singh) • START08 = Stratosphere-Troposphere Analyses of Regional Transport, 2008 4/ 21- 5/16 & June 16-28, (E.Atlas, L. Pan, K. Bowman) • SAUNA = Sodankylä Total Column Ozone Intercomparison, 2006, 3/27-4/12 • MOHAVE = Measurements Of Humidity in the Atmosphere: Validation Experiments, 2006 Oct 14-28; 2007 Oct1-15 (T. Leblanc, S. McDermid) • WAVES = Water Vapor Val. Exp., Sum 2006&07, Win 2008: H2O, O3, T, balloon sondes, lidar &…, Beltsville, MD (D. Whiteman) • Large Bal. = Large Balloon payloads, 9-10/2005, 1/2007 • ACE-FTS = Atmospheric Chemistry Experiment on Canadian satellite SCISAT-1, (P. Bernath, K. Walker) • CALIPSO = Cloud-Aerosol Lidar and Infrared Pathfinder Satellite Observation (D. Winker, J. Pelon) • HALOE = Halogen Occultation Experiment (J. Russell) • SAGE III = Stratospheric Aerosol and Gas Experiment (P. McCormick) • MIPAS = Michelson Interferometer for Passive Atmospheric Sounding on European satellite ENVISAT • COSMIC = GPS receivers on, launch June 2006 START08 P-AVE H-AVE CR-AVE INTEX-B TC4 ARCTAS SAUNA WAVES’06 MOHAVE WAVES’07 MOHAVE2 WAVES’08 ACE ENVISAT / MIPAS HALOE/UARS CALIPSO SAGE III
Validation Data Usage / Opportunities date T O3 HNO3 Clouds H2O F11 F12 CH4 NO2 N2O N2O5 ClONO2 Campaigns P –AVE 1-2/2005 O O H –AVE 6-7/2005 O X CR –AVE 1-2/2006 O O INTEX-B 3-5/2006 X P TC-4 6-8/2007 P P P P ARCTUS 4,7/2008 START08 4/2008 SAUNA 3-4/2006 X WAVES 6-7/2006 P X MOHAVE 10/2006,07 P P Large Bal. 9/2005 O O O P Large Bal.2 1/2007 P P P Networks SHADOZ O X Other -sonde X O CFH-sites P P NDACC – lidar X X – FTIR, other Satellites ACE X X X O MLS X X X O CALIPSO X HALOE X SAGE-III X MIPAS O O O O COSMIC O Models ECMWF X O GMAO O O O EUMETSAT (EPS) O O . P P P P P P O O O O O O O . P P P P O O O O . P P P P O O O O . O O . O O . O O O . O O . O O P Key: X=Published (V003, v2.04.09); O=Ongoing; P=Pending
Sonde Temperature Comparisons Statistical Differences Individual Profiles Pressure (hPa) -2 2 -2 2 Pressure (hPa) -2 2 -2 2 Temperature (K) Temperature (K) Gille et al, 2008
1 km 1 km Temperature Lidar Profile Comparisons TMF [34.5oN, 118oW] MLO [19.5oN, 156oW] Gille et al, 2008
Mean Differences Temperature comparison with COSMIC/GPS, on small vertical distance scales. COINCIDENCE: Profiles were required to be within 0.75º great circle and 500 sec of each other, giving 888 pairs.HIRDLS (V003) and COSMIC profiles were separately smoothed using a cosine bell filter of 2.8 km full width at half height (high pass filtered). The deviations from these profiles were then intercorrelated over the range 2.0 to 4.75 pressure scale height. Mean difference, HIRDLS-COSMIC, for the Double COSMIC+HIRDLS coincidences. The solid line gives the difference, the outer dashed lines give the difference +/- the standard deviation of comparisons about the mean, and the inner dashed lines give the 1 standard deviation error bars of the mean. The FORMOSAT-3/COSMIC constellation of six satellites, launched 14 April 2006, carries GPS receivers. Resolution = 1 km. J.J. Barnett
Temperature Comparison with ACE-FTS Average temperature differences (solid, HIRDLS-ACE) and standard deviation (dashed). Gille et al, 2008
Temperature: Estimated Precision Empirically determined precision for HIRDLS determined from differences of paired profiles (dashed line) at latitude cross-over points at 80°N for 2 days in March and 2 days in September, compared total precision calculated by the retrieval code (solid line). The total variation of the GMAO and HIRDLS data for those situations are also shown. Predicted: L2 retrieved parameter, f(radiance error, a priori error, Jacobians) Observed: Standard Deviation of differences at orbit-crossover. Gille et al, 2008
OZONESONDE Comparisons 1 km 1 km 1 km Nardi et al, 2008
1 km 1 km OZONE Lidar Comparisons TMF [34.5oN, 118oW] MLO [19.5oN, 156oW] Nardi et al, 2008
Ozone: INTEX-B AROTAL Lidar Nardi et al, 2008
Ozone HIRDLS v2.04.09 MLS v2.2 Polar Vortex border Anticyclone border Nardi et al, 2008
Ozone Estimated Precision June December ~50 km, ~1 hPa -- ~15 km, ~120hPa -- Shown is the ozone standard deviation in different equivalent latitude and potential temperature bins, an estimate of HIRDLS ozone precision. Results are given, in terms of percentage of mean VMR, for two days: 2006 June 20 (LEFT) and 2006 December 22 (RIGHT). In the bottom plots, the black lines highlight the 10% contour and the white lines highlight the 100% contour. Nardi et al, 2008
HNO3: ACE-FTS comparisons ΔVMR %Difference NH SH Kinnison et al, 2008
Zonal Mean Average HNO3 May 2006 (4 days) Oct 2006 (8 days) Mar 2007 (27 days) Kinnison et al, 2008
Airborne profile comparisons - Houston AVE [June 2005] (CIMS = Chemical Ionization Mass Spectrometer) HIRDLS (red) NOAA CIMS (blue) For this flight, HIRDLS HNO3 is broadly consistent with the NOAA CIMS instrument in the 100 hPa - 75 hPa region. Below this region, HNO3 filaments as measured by CIMS are not captured. The reason for this is currently not understood. Kinnison et al, 2008
HIRDLS HNO3 Filaments “Latitude-height comparisons of meteorological products from the NCEP GFS and HIRDLS O3 and HNO3 data products for the orbit segment shown in Figure 17. (top) Color contours of potential vorticity; the solid black line is for the 3 pvu contour. Horizontal wind contours are shown in white (for every 5 m/s). The 400 K potential temperature contour is shown as a blue dashed line. The tropopause pressure altitude is shown as filled black circles. Color contours of (middle) HIRDLS O3 (ppmv) and (bottom) HNO3 (ppbv). The white contour lines are the horizontal wind contours for 26 and 28 m/s.” Kinnison et al, 2008
HNO3 Estimated Precision June December Shown is the HNO3 standard deviation in different equivalent latitude and potential temperature bins, an estimate of HIRDLS HNO3 precision. Results are given, in terms of percentage of the mean VMR, for two days: 2006 June 20 (LEFT) and 2006 December 22 (RIGHT). In the bottom plots, the black lines highlight the 10% contour and the white lines highlight the 100% contour. Kinnison et al, 2008
Detection of Sub-Visual Cirrus Layer (12 µm, channel #6) Tropical Cirrus Layer Cirrus Layer Extinction Profile 700 % Radiance Perturbation Massie, et al, 2007
Cloud Top Pressure Determinations Compare the cloud counting capability of the HIRDLS with HALOE. Massie, et al, 2007
Cirrus Frequency of Occurrence Derived from Radiance-based cloud detection algorithm. (types 1,2) Latitude Derived from Multi-spectral Extinction (all clouds) Latitude Longitude Massie, et al, 2007
Seasonal Variations of Cirrus Layers CALIPSO HIRDLS Winter NH Spring NH Summer NH Fall NH Massie, et al, 2007
Summary of quality of V003 (v2.04.09) products Temperature: P-Range: 1-300 hPa Precision: 0.5K at 10-100 hPa; 1K @ 1 hPa (v2.02.07) Accuracy: ±2K at 1-100 hPa Ozone: Range: 1-100+ hPa (mid-high Lat), 1-50 hPa (tropics) Precision: 5-10% Accuracy: 2-10% at 1-10 hPa; biased generally low 5% high bias ~10-30 hPa 0-20% low bias, ~30-100+ hPa (mid & high latitudes) Nitric Acid: Range: 10-100 hPa, 10-50 hPa (tropics) Precision: 10-35% at 100-10hPa Accuracy: ~10% (at 10hPa) to 30% (at 100hPa); biased low [ACE-FTS] Clouds/Aerosol: Range: 400 hPa- 10 hPa Correlation with other instruments: SAGE & HALOE (cloud-top pressure): 0.85 - .93 CALIPSO horizontal cloud scale: 0.99 Extinction retrieval successful at rate 70%: improvements to be released Vertical Resolution: ~1 km
Status of HIRDLS data products 1. Temperature, Ozone, HNO3, clouds: - significantly improved T, O3, cloudsto be released soon (V004). - significantly improved HNO3 likely in subsequent release (Fall 2008?) 2. CFC-11, CFC-12, 12.1-micron extinction: - to be newly released soon (V004). 3. H2O: most promising for subsequent release. 4. CH4, NO2, N2O, ClONO2, N2O5: – not ready to release; significant improvements made and are ongoing.
List of validation & related publications • Alexander, M. J., et al. (2008), Global estimates of gravity wave momentum flux from High Resolution Dynamics Limb Sounder observations, J. Geophys. Res., 113, D15S18, doi:10.1029/2007JD008807. • Coffey et al, Airborne Fourier transform spectrometer (FTS) observations in support of EOS Aura validation, J. Geophys. Res., 113, D16S42, doi:10.1029/2007JD008833, 2008 • Gille et al, The High Resolution Dynamics Limb Sounder (HIRDLS): Experiment Overview, Results and Validation of Initial Temperature Data, JGR, In Press. • Kinnison et al, Global Observations of HNO3 from the High Resolution Dynamics Limb Sounder (HIRDLS) – First results, JGR, In Press. • Massie, S., et al. (2007), High Resolution Dynamics Limb Sounder observations of polar stratospheric clouds and subvisible cirrus, J. Geophys. Res., 112, D24S31, doi:10.1029/2007JD008788. • Nardi, B., et al. (2008), Initial validation of ozone measurements from the High Resolution Dynamics Limb Sounder, J. Geophys. Res., 113, D16S36, doi:10.1029/2007JD008837. • Selected recentrelevant HIRDLS publications • Barnett, J.J., J.N. Bracken, K. Djotni, C.L. Hepplewhite, J.L. Moorhouse, O.O. Oduleye, C.W.P. Palmer, D.M. Peters, L.A. Rokke, T.W. Walton, R.E.J. Watkins, J.G. Whitney, J.C. Gille, P.I. Arter, T.D. Eden, B. Nardi (2003), Pre-launch calibration of the NASA AURA HIRDLS instrument, Proc.SPIE 5152, 172-180. • Eden, T., J.J. Barnett, J.C. Gille, C.L. Hepplewhite, C.W.P. Palmer, J.G. Whitney (2007), Spectral Characterization of the HIRDLS Flight Instrument from Pre-launch Calibration Data, submitted IEEE. • Eden, Thomas, et al., Radiometric Calibration of the HIRDLS Flight Instrument from Pre-launch Calibration Data, in preparation for IEEE. • Gille, J.C., et al., (2005) Development of special corrective processing of HIRDLS data and early validation (Conference Proceedings Paper), SPIE, Vol 5883, 13 Sept 2005. • Gille, J.C., J.J. Barnett, J.C. Whitney, M.A. Dials, D.M. Woodard, W. Rudolf, A. Lambert, W. Mankin (2003), The High Resolution Dynamics Limb Sounder (HIRDLS) Experiment on Aura, Proc.SPIE 5152, 162-171. • Hepplewhite, C.L., J.J. Barnett, J.C. Whitney, C.W.P. Palmer, O.O. Oduleye, T. Walton, M.A. Dials, J.C. Gille, T. Eden, B. Nardi (2005), HIRDLS Functional Performance in Orbit – A summary, Proc. SPIE 5883, J1-10. • Khosravi et. al. (2007) Retrieval Algorithm and Characterization for the High Resolution Dynamics Limb Sounder (HIRDLS), in preparation for IEEE Trans. Geosci. Remote Sens. • Moorhouse, J.L., J.J. Barnett, K. Djotni, C.L. Hepplewhite, C.W. P. Palmer, O.O. Oduleye, T. Walton, R.E.J. Waktins, J.G. Whitney, J.C. Gille, P. Arter, B. Nardi (2003), HIRDLS field of view calibration techniques and results, Proc. SPIE, 5152, 193-203. • Yudin, Valery, et al. (2007), Constraining Middle Atmosphere Models by Space-borne Observations: Zonal Mean Flow and Tides, SPARC/WCRP Data Assimilation Workshop, Toronto, Canada, Sept. 2007 • … others, including updates, in progress
Ozone Comparison with ACE-FTS ΔVMR %Difference NH SH Cora Randall
1 hPa 3 hPa 10 hPa Comparisons with MLS v2.2 Ozone [Zonal Mean] 2006Feb 2006May 31 hPa 2006Jul 2006Oct 51 hPa 100 hPa O3 Percent Diff (%) O3 Percent Diff (%) Ozone Comparisons with MLS v2.2 Ozone on pressure surfaces [Mercator] O3Percent Diff (%) O3Percent Diff (%) V. Lynn Harvey