Download
1 / 23
230 likes | 362 Vues
Responding To The 2010-11 Executive Budget. with a “Framework for the Future”. Presented by: Gary D. Bixhorn SCSSA Legislative Committee Chairperson. Longwood Legislative Breakfast February 6, 2010. Executive Budget Impact on Long Island. REGIONAL IMPACT

E N D
Responding To The 2010-11 Executive Budget with a “Framework for the Future” Presented by: Gary D. Bixhorn SCSSA Legislative Committee Chairperson Longwood Legislative Breakfast February 6, 2010
Executive Budget Impact on Long Island REGIONAL IMPACT • Long Island educates 17% of the state’s students, receives only 12.5% of the state aid, but will absorb 13.6% of the statewide aid loss proposed by the Governor’s Executive Budget for school aid. • Long Island’s proposed aid cut is 7.2% ($172,680,929). The statewide cut is 6.7% ($1,267,274,873). • The proposed loss of state aid ($172,680,929) will cause an increase of nearly 6.0% in Long Island’s property tax levy assuming that budgets rise by 2.5% next year. • Long Island’s 2010-11 aid reduction (7.2%) is 7% higher than the statewide aid reduction (6.7%). 1
Executive Budget Impact on Long Island FOUNDATION AID • The Foundation Formula, which will drive 84% of all school aid ($14,892,215,595), continues to be a key reason that Long Island schools are under-funded by the state. Long Island’s share of state funding has been maintained with High Tax Aid ($139,303,943) since the Foundation Formula was introduced. • Foundation Aid provides $3,300 per pupil to Long Island schools; this is 38% lower than the statewide average of $4,600. The statewide average excluding Long Island is $4,862. 2
Executive Budget Impact on Long Island LOW-WEALTH SCHOOL DISTRICTS • Nearly 38% of students on Long Island are enrolled in twenty-nine school districts with wealth levels below the state average (CWR<1.0). • Twenty-nine Long Island low-wealth (CWR<1.0) school districts will suffer an average per pupil aid loss of $493. • Twenty-one Suffolk County low-wealth (CWR<1.0) school districts, enrolling 133,000 would have aid reduced by $68.8 million. • Eight Nassau County low-wealth (CWR<1.0) school districts, enrolling 41,000 would have aid reduced by $16.9 million. • The proposed loss of state aid ($85.7 million) to Long Island’s 29 low-wealth (CWR<1.0) school districts will cause an increase of nearly 9.0% in their combined tax levy assuming that their budgets rise by 2.5% next year. 3
Executive Budget ReviewVariations in Ability to Pay • Long Island and Mid-Hudson Valley have widest disparities between property and income • Long Island incomes now only slightly above average “Upper upstate” – poor and falling further behind (next slide) State average Source: Council analysis of NYSED school aid data 4
Executive Budget ReviewTrends in Ability to Pay • Long Island, and Mid-Hudson Valley: Huge disparities between property and income changes. • Upstate: Slow growth in property wealth means more of any additional local revenue must come from tax increases, rather than tax base growth Source: Council analysis of NYSED school aid data; 8 small districts omitted due to incomplete data 5
Executive Budget ReviewMeasures of Tax Effort • Lower Hudson Valley has the highest effort measured by local tax revenue per pupil. • Long Island and Mid-Hudson Valley have highest effort measured by residential property taxes paid as percent of income. • Upstate regions have highest effort measured as a tax rate against full value property wealth. • Some poor districts could double or triple their tax effort and still not raise as much revenue per pupil as affluent communities. Source: Council analysis of NYSED data. * Tax levy includes both property and non-property taxes (STAR not included); ** data for New York City is omitted (measure understates NYC effort by omitting revenue from the City income tax and property taxes levied on apartment buildings). 6
Executive Budget Review Major Elements of Proposed Budget • $1.1 billion (5%) cut in School Aid compared to 2009-10. ($1.45 billion cut from current law formulas). • Includes $1.41 billion one-time “Gap Elimination Adjustment • Apply wealth adjustment to state reimbursement for Summer School Age Special Education ($86 million cut). • Use federal funds for Preschool Special Education ($61 million savings for state). • Prospectively, shift from counties to schools responsibility for growth in costs over 2%. • Continue freeze of Foundation Aid one more year (to 2011-12); extend phase-in to 2016-17. • Some STAR cuts – no exemptions on homes over $1.5 million; raise maximum exemption decrease from 11% to 18% • Cut State Education Department General Fund operating budget by 16% (53 positions). Only 7% of operating budget would be supported by state taxes. 7
Council of Administrators and Supervisors Eastern Suffolk BOCES L.I. Association of School Personnel Administrators L.I. School Public Relations Association Nassau County BOCES Nassau County Council of School Superintendents Nassau County Elementary School Principals Association Nassau County Secondary School Administrators Association Nassau Region PTA Nassau-Suffolk School Boards Association Nassau Association of School Business Officials New York State United Teachers (Nassau-Suffolk) Reform Educational Financing Inequities Today (R.E.F.I.T.) School Administrators Association of New York State (Nassau-Suffolk) SCOPE Education Services Suffolk Association of School Business Officials Suffolk County High School Principals Association Suffolk County School Superintendents Association Suffolk Region PTA Western Suffolk BOCES LIEC Co-Chairpersons: Judith Chen & Vincent Lyons The LIEC –Working Together on the “FRAMEWORK FOR THE FUTURE” 8
Issues Driving the “Framework for the Future” • Foundation Formula Inequities • Stimulus Funding Ends • Rising State Deficit • Introduction of Inequitable State Aid Reductions (GEA/ High Tax Aid) • Rising Property Tax Dependence • Rising Costs 9
LIEC “Framework for the Future” Raise the state share of educational funding to 50% Allocate new funding through “expense driven” formulas aiding: Special Education Employee Health Insurance Coverage Pension Costs Create opportunities to reduce costs Fix the Foundation Formula Provide greater transparency 10
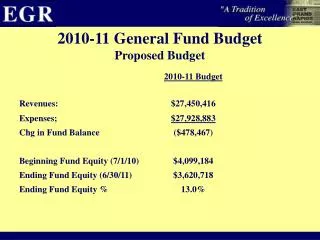
2008-09 Basic Data – New York State Statewide Cost of Education $50.5B State Support for Education (State Aid) $21.0B State Share 41.6% Statewide Property Tax Levy $27.9B Source: NYSED State Aid Office 50% Goal 11
2008-09 Basic Data – Costs Statewide Cost of Education $50.5B • Special Education Costs $6.7B • Health Insurance Costs $4.9B • Pension Costs $3.5B Source: NYSED State Aid Office 12
2008-09 Basic Data – State Support Total State Aid $21.0B (100%) • Foundation Aid $14.8B (70.6%) • All Other Aid $ 6.2B (29.4%) Additional Aid Required to Reach 50% $ 4.2B Additional Foundation Aid Promised* $ 3.8B Source: NYSED State Aid Office *By 2012-13 13
2008-09 Basic Data – Local Support Statewide Property Tax Levy $27.9B Reduction Due to Proposed Aid Increase 15.1% (50% State Share) Source: NYSED State Aid Office *Fully phased in $4.2 billion 14
Why the “Framework” is Necessary *NYSED computer runs December 2008 15
Why the “Framework” is Necessary Basic Data – Regional Wealth CWR< 1.000 16
Why the “Framework” Works • Structural change to promote fairness • Offsets Foundation Formula inequities • Phase in as “new” money becomes available • Cost reduction initiatives implemented • Transparency enhanced • Offers time to “fix” the Foundation Formula 20
Timeline for Action The Need is Real. The Time is Now - ONE ISLAND – ONE VOICE 21
For additional information contact: Gary Bixhorn SCSSA Legislative Committee Chairperson gbixhorn@esboces.org Letter Writing Campaign Contact: David Gamberg dgamberg@southoldufsd.com 22