Download
1 / 22
220 likes | 307 Vues
Explore galaxy properties & clustering in DEEP2 Survey at z=1. Spectra study beyond z=1 with DEIMOS spectrograph on Keck II telescope. Evaluation of clustering via redshift maps, correlation functions & bias analysis.

E N D
Galaxy Clustering and Environment Results from the DEEP2 Survey Alison Coil UC-Berkeley for the DEEP2 Survey Team August 2004
The DEEP2 Collaboration U.C. Berkeley: M. Davis (PI), A. Coil, M. Cooper, B. Gerke, R. Yan, C. Conroy U.C. Santa Cruz: S. Faber (Co-PI), D. Koo, P. Guhathakurta, D. Phillips, C. Willmer, B. Weiner, R. Schiavon, K. Noeske, A. Metevier, L. Lin, N. Konidaris, G. Graves Hawaii: N. Kaiser LBNL: J. Newman U. Pitt.: A. Connolly JPL: P. Eisenhardt Princeton: D. Finkbeiner
A Redshift Survey at z=1: The DEEP2 Galaxy Redshift Survey, which uses the DEIMOS spectrograph on the Keck II telescope, will study both galaxy properties and the clustering of galaxies at z=1. Comparison with local samples: • 3.5 sq. degrees • 4 fields (0.5o x 2o) • primary z~0.7-1.4 • ~50,000 redshifts • ~6·106 h-3Mpc3 • 90 Keck nights • One-hour exposures • RAB=24.1 SDSS 2dF LCRS DEEP2 z~0 z~1 CFA+ SSRS PSCZ
By applying a relatively simple BRI color cut, we have a sample that is 13% z<0.75, vs. >60% with no cut. Only 3% of objects that we reject are at z>0.75. In the Extended Groth Strip, we apply no color cut, enhancing multiwavelength studies and also making this test possible. Our color cuts are highly successful!
Obs. R-I Color bimodality Rest U-B DEEP2 vs. previous surveys of distant galaxies Galaxies found in large numbers well beyond z=1 note the z=0.7 color cut
Slitmask spectroscopy Using custom-milled slitmasks with DEIMOS we are obtaining spectra of ~120 targets at a time. A total of 480 slitmasks will be required for the survey; we can tilt slits up to 30 degrees to obtain rotation curves.
A fully automated reduction pipeline SDSS spectral pipeline code by Schlegel et al. allowed us to rapidly develop a full 2d and 1d spectral reduction pipeline that is completely automated. Check z’s by eye. A few percent of one DEEP2 mask, rectified, flat-fielded, CR cleaned, wavelength-rectified, and sky subtracted. Note the resolved [OII] doublets. Shown is a small group of galaxies with velocity dispersion 250 km/s at z1. Note the clean residuals of sky lines!
Status of the DEEP2 Survey • DEIMOS commissioning began June 2002 under clear skies and was extremely successful. • DEEP2 observing campaign began in July 2002. At the end of 3 semesters of the 6 planned, we had completed 48% of the survey slitmasks! We are on schedule! • Observations complete mid-2005. Currently ~60% done!
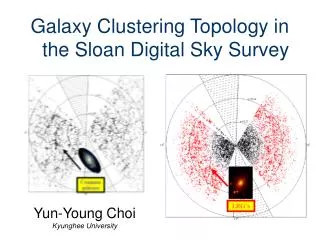
Clustering in DEEP2: First Redshift Maps Projected maps of two DEEP2 pointings (of 13 total). Red = early-type (from PCA).
2-point correlation function: x(r) x(r) follows a power-law prescription locally: x(r) = (r0/r)g with r0~5 Mpc/h and g~1.8. r0 = scale where the probability of finding a galaxy pair is 2x random From the projected function wp(rp) we can recover the real-space correlation function x(r)= (r0/r)g z=0.7-0.9: r0=3.53 +/-0.81 z=0.9-1.35: r0=3.12 +/-0.72 both have slope g= 1.66 +/-0.12 Errors are estimated using mock catalogs - dominated by cosmic variance
Galaxy bias: galaxy/dark matter clustering Bias evolves with redshift: z=3: b~4 z=0: b~1 DEEP2 sample as a whole: b=0.96 +/-0.13 for s8=1 today b=1.19 +/-0.16 for s8=0.8 today could be the result of our R-band target selection – we’re under-sampling older, red stellar populations Coil et al. 2004 astro-ph/0305586 Galaxy formation simulation by Kauffmann et al. grey=dark matter particlescolors=galaxies
Clustering as a function of Color and Spectral Type Red galaxies: dashed lines Blue galaxies: solid lines Redder galaxies have a larger correlation length and larger velocity dispersion, as do absorption-line galaxies: reside in more clustered / dense environments.
Galaxy Clustering: color, type, luminosity Color B-R>0.7: r0= 4.32 (0.73) g=1.84 (0.07) B-R<0.7: r0= 2.81 (0.48) g=1.52 (0.06) Spectral Type Absorption: r0= 6.61 (1.12) g=1.48 (0.06) Emission: r0= 3.17 (0.54) g=1.68 (0.07) Luminosity Brighter MB<-19.75: r0= 3.70 (0.65) g=1.60 (0.06) Fainter MB>-19.75: r0= 2.80 (0.48) g=1.54 (0.06) Redder, passively-evolving and/or more luminous galaxies cluster more strongly than bluer, star-forming, less luminous galaxies - similar as z~0 results
Projected Angular 2-pt corr. fnct: w(q) Have photometry for many more galaxies than spectra: ~350,000 galaxies over 5 deg2, incl. z<0.7 Projected angular 2-point correlation function: w(q) Constrain the 3d galaxy clustering x(r) * if the z dist. of the sources is known slope = -0.8: 7” 3’ Smooth decrease in clustering with magnitude. Errors are variance across 15 pointings.
Evolution of Galaxy Clustering Angular correlation function is an integral of the 3-d clustering along the line of sight. Use DEEP2 spectroscopic sample to measure the redshift distribution of sources in various magnitude ranges. Data is from the Groth Strip where we have no photo-z cut – 3320 galaxies. dn/dz=A z2 e(-z/z0)/z03 x(r,z)= x(r,z=0) (1+z) –(3+e-g) e=-1.2 fixed in comoving coords. e=0 fixed in proper coords. e>0 clustering grows in proper coords. We find no single value of e fits our data – e must evolve with z. We see significant growth in the clustering amplitude from z>1 to 0.
Angular Clustering as fnct. of R-I color In addition to a trend of redder galaxies being more clustered, the bluest galaxies (R-I <0.2) are also highly clustered – unexpected! blue red blue Redshift distribution of color samples: Reddest galaxies are at z~0.85, narrow Bluer samples are at lower z, wider Bluest samples have significant components at z<0.5 and z~1.7 red
Clustering as a function of R-I color Corrected for z>1.4 galaxies Bluest galaxies are a mix of brightest objects at z>1.4, local faint blue dwarfs, and AGN between z~0-2 Reddest galaxies are likely z>0.5 progenitors of local ellipticals Coil et al. 2004 astro-ph/0403423
Measure galaxy environment using projected Nth-nearest neighbor distance. See strong trends of restframe color and OII equivalent width with environment. No residual trend in OII EW once the correlation of environment with color is removed. Galaxy properties and environment environment bluecolorred OII equivalent width Cooper et al. in prep
Color-magnitude vs environment Color vs mag. w/ density contours darker regions = more dense Redder galaxies reside in denser environments, with the brightest red galaxies in the most dense environments. Within the blue galaxy population, the brightest also lie in the most dense environments - progenitors of central cluster galaxies at z~0? Bright blue galaxies in densest environments
Galaxy Groups and Clusters in DEEP2 Voronoi-based methods can also be used to identify clusters and groups of galaxies (Marinoni et al. 2002). DEEP2 group catalogs in two of our pointings will be published shortly. This will allow both the study of group property distributions and of group vs. field galaxies. red=absorption-dominated red=pairs; blue=N>2; sizelog () log (halo mass) Gerke et al. in prep
Now looking at group correlations and void statistics… Group-group correlation function is larger than the galaxy-galaxy correlation function. Field galaxies are less clustered than the full galaxy sample, which is less clustered than galaxies in groups. Coil et al. in prep
Conclusions Galaxy Clustering: r0~3.5 Mpc/h at z~1, b~1.0-1.2 for DEEP2 galaxies. Red, passively-evolving galaxies have larger fingers of God and r0 than blue, star-forming galaxies at z~1. See some luminosity-dependence in the clustering strength. Strong dependence of angular clustering on observed color: red galaxies at z~0.8 have r0~6.5 Mpc/h blue galaxies at z>1.4 have r0>~5 Mpc/h Environment: Color and OII EW correlate strongly with local environment at z~1. Find a population of bright blue galaxies in the densest environments at z~1 which do not exist at z~0 - central cluster galaxies?